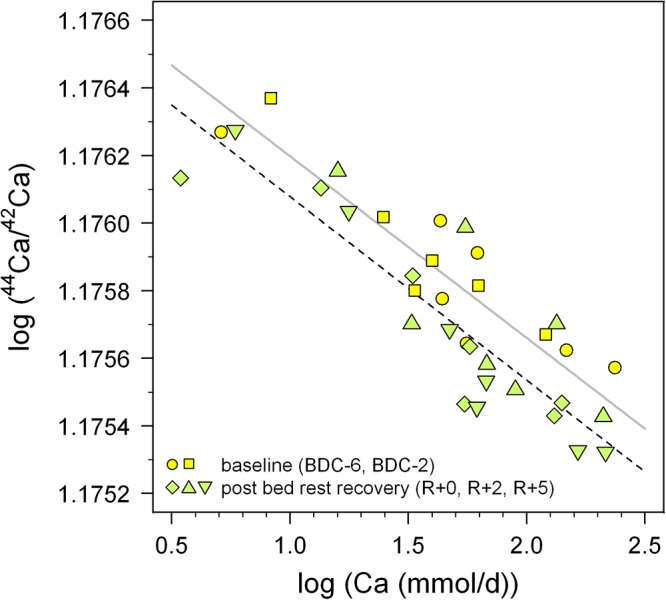
Figure 8.

Log-log plot of 44Ca/42Ca in urine versus daily-excreted Ca (mmol/d) for the pre-bed rest BDC data (BDC-6 and BDC-2, yellow squares) and directly after the bed rest phase (R + 0, R + 2, and R + 5, green diamonds). Both sets of data show negative correlations with trend lines indicated (BDC, gray; R + 0, black dashed), with the after bed rest data shifted systematically toward lower 44Ca/42Ca, i.e., more negative δ44/42Ca. This vertical offset likely reflects bone loss during bed rest independent of changes arising from variable renal Ca reabsorption in the kidneys.
