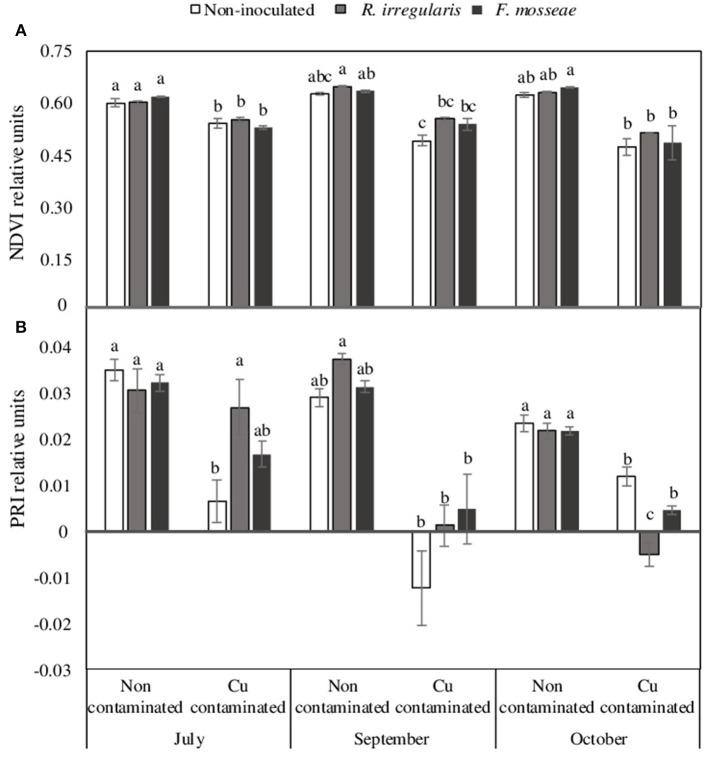
Figure 2.
(A) Normalized difference vegetation index, NDVI and (B) Photochemical reflectance index, PRI, data of Touriga Nacional grapevine variety plants grafted onto 1103 Paulsen rootstock growing in Cu-contaminated or non-contaminated soil at different time points during the growing season. Bars indicate the average of five plants per treatment ± standard error. Different letters indicate significant differences at each month (July, September or October) according to Tukey b or Dunn-Bonferroni tests at p ≤ 0.05.

