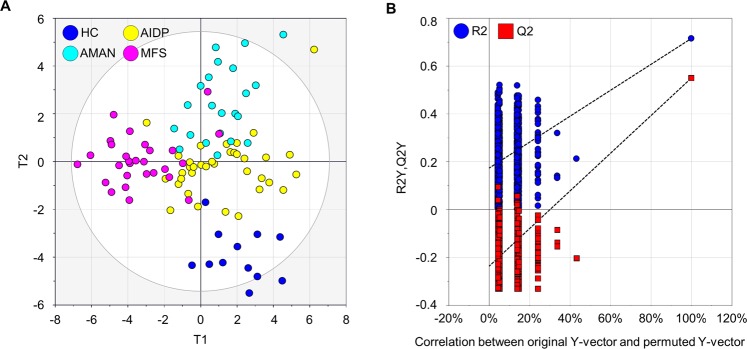
Figure 3.
Distinctive metabolic phenotypes among different types of GBS variants and the healthy controls. (A) Score scatter plot based on multivariate statistical model by PLS-DA. HC: healthy control. (B) Random permutation plot (999 times) on the datasets of the four groups. The vertical axis presents R2 (blue points) and Q2 (red points) values of the model. The horizontal axis shows the correlation coefficient between the original and the permuted Y-variable.

