Figure 1.

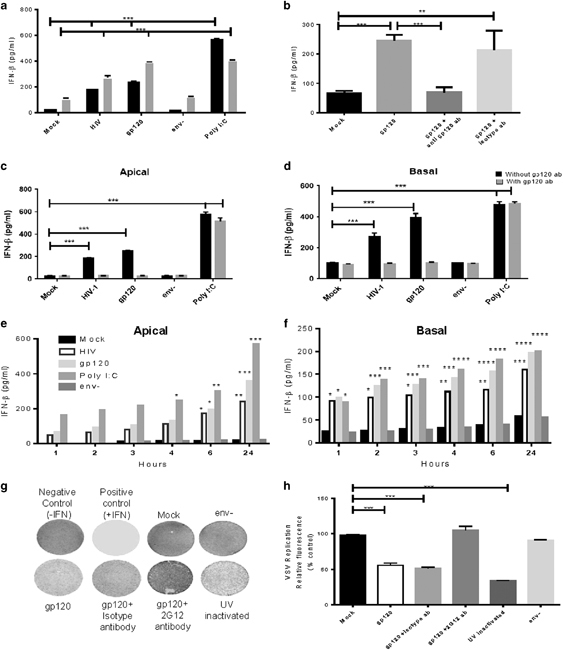
Primary endometrial epithelial cells respond to HIV-1 envelope gp120 by production of IFNβ. (a) Confluent monolayers of primary endometrial GECs were exposed to medium (mock), HIV (105 IU/well), gp120 (100 ng/ml), env − HIV mutant (105 IU/well) or UV-inactivated HIV for 24 h and supernatants were analyzed for IFNβ production. IFNβ was measured by ELISA in both apical (black bars) and basolateral (gray) supernatants. Endometrial GECs produce significant amounts of IFNβ in response to HIV, gp120 and poly I:C when compared with mock-treated cells. N=4. (b) Endometrial GECs were exposed to gp120 alone or with anti-gp120 neutralizing (2G12) or isotype antibody for 24 h, apical supernatants were collected and analyzed for IFNβ production by ELISA. N=2. (c, d) Endometrial GECs were exposed for 24 h to medium (mock), HIV, gp120, env − HIV mutant or poly I:C, with or without anti gp120 neutralizing antibody. IFNβ production in supernatants was determined without gp120 antibody (black bars) or following treatment with anti gp120 antibody (gray bars). (e, f) Time course for IFNβ production was analyzed in supernatants collected from endometrial GECS after exposure to medium (mock), HIV, gp120, poly I:C, env − HIV mutant for 1, 2, 3, 4, 6 and 24 h. IFNβ production in apical (c) and basal (d) supernatants was measured by ELISA. (g) Endometrial GECs were exposed to mock or env − mutant or gp120 alone or in the presence of either isotype antibody or gp120 neutralizing antibody or UV-inactivated HIV-1 for 24 h. Supernatants were tested by VSV-GFP assay on Vero cells to determine biological activity of type I IFNs. VSV-GFP was added to Vero cells without a pretreatment (negative control), recombinant IFNβ (100 pg/ml) added to Vero cells before VSV infection (positive control) or supernatants collected from treatments done in above experiments. GFP fluorescence, an indicator of VSV-GFP infection, was quantified by scanning the plates on a Typhoon Biomolecular imager. Images are representative of three separate experiments conducted in triplicate. (h) Quantitative representation of VSV-GFP fluorescence. Each experimental condition was compared with negative control and calculated as percent of negative control. Data shown represent mean±s.e.m. of three separate experiments from cells isolated from three individual tissues. *P<0.05, **P<0.01 and ***P<0.001. ELISA, enzyme-linked immunosorbent assay; GEC, genital epithelial cell; GFP, green fluorescent protein; IFNβ, interferon-β; poly I:C, polyinosinic:polycytidylic acid; UV, ultraviolet; VSV, vesicular stomatitis virus.
