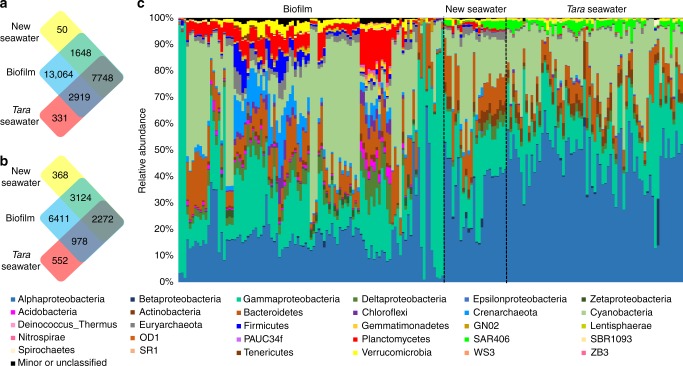
Fig. 1.
Comparative taxonomic analysis of the 101 biofilm and 24 seawater metagenomes sequenced as part of the current study and the 67 previously published Tara Oceans metagenomes. a Venn diagram showing the distribution of all OTUs. b Venn diagram showing the distribution of abundant OTUs (OTUs with more than nine tags in at least one sample). c Phylum-level taxonomic structure revealing marked differences in the community profiles between the biofilm and seawater habitats. Relative abundance of the phyla was calculated based on 16S miTag numbers. Abundant phyla (the top 30 phyla in terms of maximum relative abundance) are shown with all other phyla grouped together as “Minor”. The order of samples in this figure is the same as that in Supplementary Data 1

