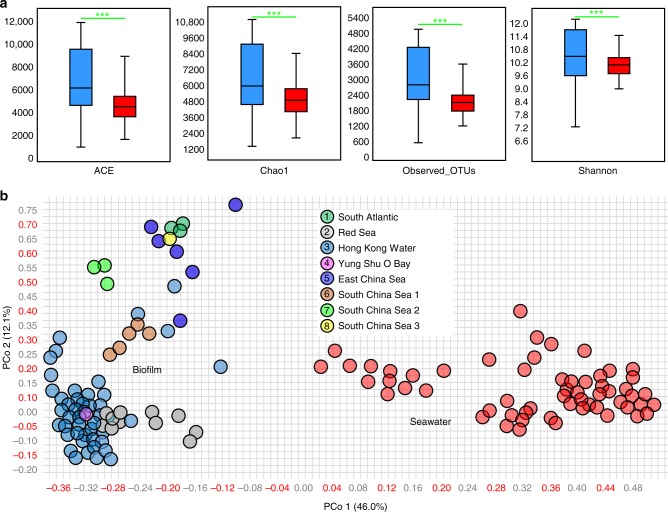
Fig. 3.
Alpha- and beta-diversity. a ACE, Chao1 diversity, and observed OTUs are significantly different between the biofilm-associated (blue) and seawater-derived (red) microbial communities. ***p-value < 0.001 (two-tailed Student’s t-tests after Shapiro–Wilk test to confirm the normal distribution of these data). In a boxplot, central line represents the median, bounds represent upper and lower quartiles, and whiskers represent maximum and minimum. b Jaccard similarity of the microbial communities illustrated by PCoA of the OTU matrix. These analyses were performed after normalizing the different metagenome-derived 16S rRNA gene data to the same library size, i.e. 10,000 sequences per sample

