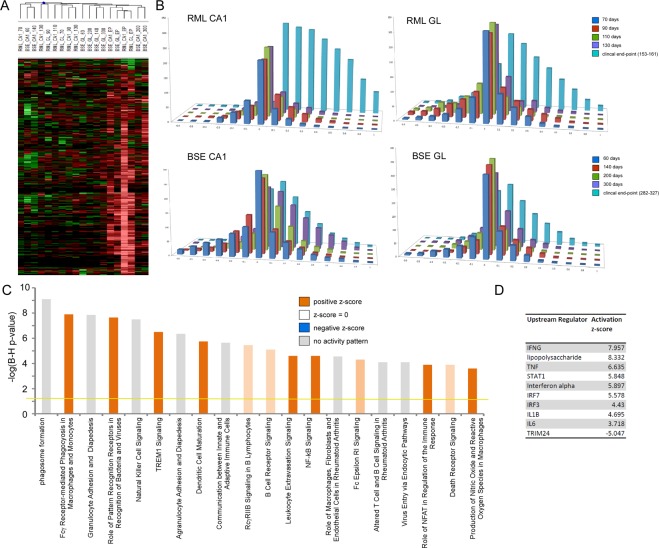
Figure 2.
Dynamics and Gene Ontology analysis of genes that are enriched in microglia. (A) Heat map of microglia-enriched genes differentially expressed across excised hippocampal CA1 and cerebellar granule layer regions from mice infected with RML scrapie and BSE strains of prions at one or more time-point after unsupervised hierarchical clustering (n = 4–6 for each time-point). (B) Bar chart shows the number of microglia genes differentially expressed across excised hippocampal CA1 and cerebellar granule layer tissue in infections of mice with RML scrapie and BSE prions. The log ratio for each gene was binned in 0.1 increments along the x-axis, and the number of genes in each bin on the y-axis. (C) IPA analysis shows the top 20 canonical pathways that were deregulated by microglia-enriched genes at the clinical end-point of disease. The color of the bars indicates predicted pathway activation based on z-score (orange = activation; blue = inhibition; gray = no prediction can be made; white = z-score close to 0). The horizontal yellow line indicates the p-value threshold. Fisher’s exact test, right-tailed, was used to calculate negative log of p-value. (D) IPA analysis shows the top 10 predicted upstream regulators of microglia gene expression at the clinical end-point of disease based on z-score.

