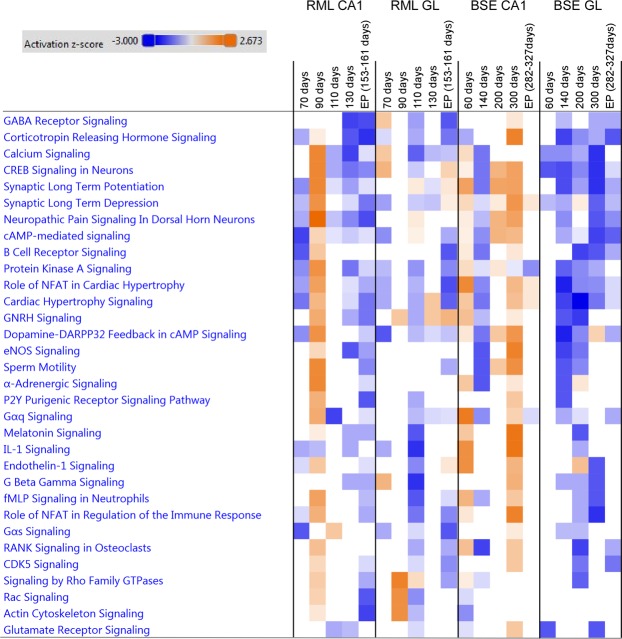
Figure 6.
Comparison analysis of canonical signaling pathways temporally activated in neurons during prion infection. Heat map showing top activated canonical pathways generated using genes with expression enriched in neurons during prion infections. Upregulated pathways are shaded orange, down-regulated pathways are shaded blue. The intensity indicates the degree that each gene was up-regulated or down-regulated as determined by the IPA determined z-score.

