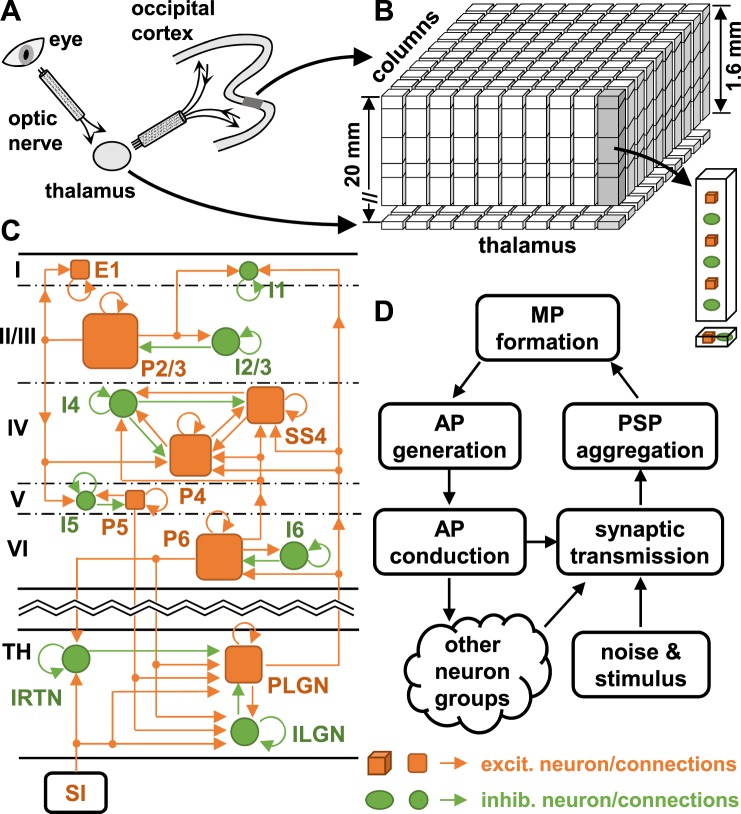
Figure 1.
Architecture of the LCM. Illustrated are (A) the visual pathway in cats, (B) the structure of the LCM, (C) the synaptic connections between neurons simulated in the LCM, and (D) the neuronal processes simulated in the LCM. In Figure (C), the arrows indicate the direction of synaptic transmission; and sizes of squares and circles indicate the relative densities of corresponding neuron groups (not to scale). Only a partial synaptic connection map is shown; a complete map is provided in Table S5 in the Supplementary Information. Acronyms: SI–sensory input; TH–thalamus; AP–action potential; PSP–postsynaptic potential; MP–membrane potential; E1–excitatory neurons in layer I of the cortex; I1–interneurons in layer I; P2/3–pyramidal neurons in layer II and III; I2/3–interneurons in layer II and III; P4–pyramidal neurons in layer IV; SS4–spiny stellate neurons in layer IV; I4–interneurons in layer IV; P5–pyramidal neurons in layer V; I5–interneurons in layer V; P6–pyramidal neurons in layer VI, I6–interneurons in layer VI; IRTN–interneurons in RTN of the thalamus; RLGN–relay neurons in LGN of the thalamus; ILGN–interneurons in LGN.

