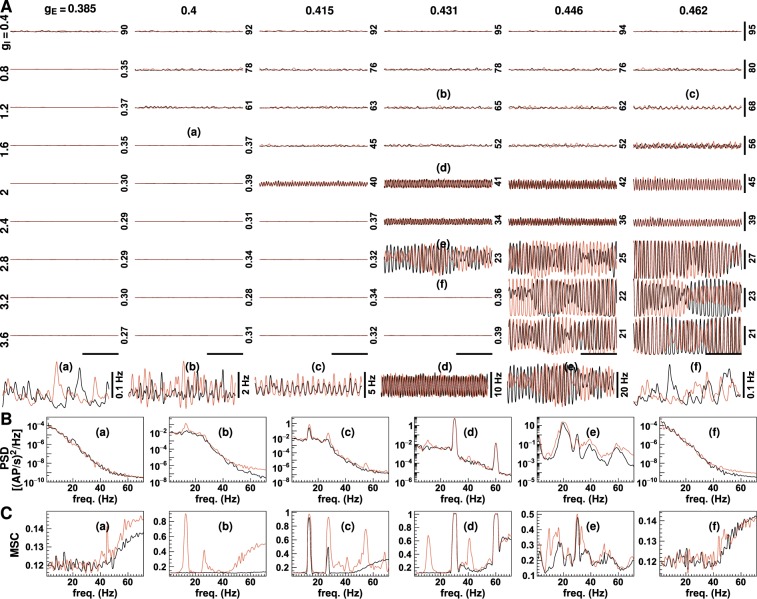
Figure 2.
Neuronal firing rates with different synaptic gains. The plots in panel (A) displays firing rates simulated without (black lines) and with stimulus (red lines) using a range of excitatory and inhibitory synaptic gains. The excitatory and inhibitory synaptic gain values are shown on the top and the left, respectively [unit: uV/(mV · Hz)]. The number on the right of each figure indicates the value at the middle of the vertical scale bars (unit: AP/sec). The vertical scale bars on the right represent a firing rate of 20 AP/sec, and the horizontal scale bars at the bottom represent a period of 500 msec. Six amplified firing rate traces are plotted below the panel. The figures in panels (B and C) show the power spectrum densities (PSD) and magnitude-squared coherence (MSC) of six typical neuronal firing rates in panel (A). Corresponding plots are indicated by the lower case letters (a–c etc.). See also Fig. 3.

