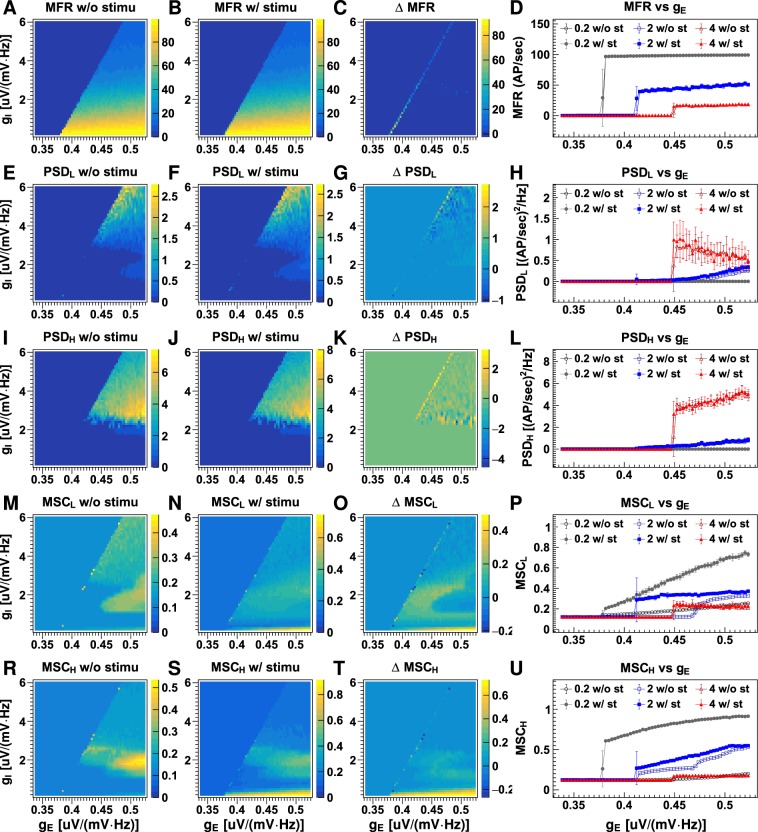
Figure 3.
Neuronal firing rate properties with different synaptic gains. The plots display the mean firing rates (MFR) without stimulation (A), with stimulation (B), their differences (C) and dependency on excitatory gain for three typical inhibitory gains (D); the mean power spectrum density over firing rates of 2–15 Hz (PSDL) without stimulation (E), with stimulation (F), their differences (G) and dependency on excitatory gain (H); the mean power spectrum density over firing rates of 16–50 Hz (PSDH) without stimulation (I), with stimulation (J), their differences (K) and dependency on excitatory gain (L); and the mean magnitude-squared coherence for firing rates of 2–15 Hz (MSCL) without stimulation (M), with stimulation (N), their differences (O) and dependency on excitatory gain (P); the mean magnitude-squared coherence for firing rates of 16–50 Hz (MSCH) without stimulation (Q), with stimulation (R), their differences (S) and dependency on excitatory gain (T). Discrete values for synaptic gain were used with minimum intervals of 0.003 uV/(mV · Hz) and 0.1 uV/(mV · Hz) between adjacent values for excitatory and inhibitory synaptic gain respectively. On the right column, the lines with open and closed markers display results for datasets without and with stimulus, respectively. Error bars on the line plots show the standard deviations (SD) for 10 runs of the LCM with the same parameter values but different random number kernels. See also Fig. 4.

