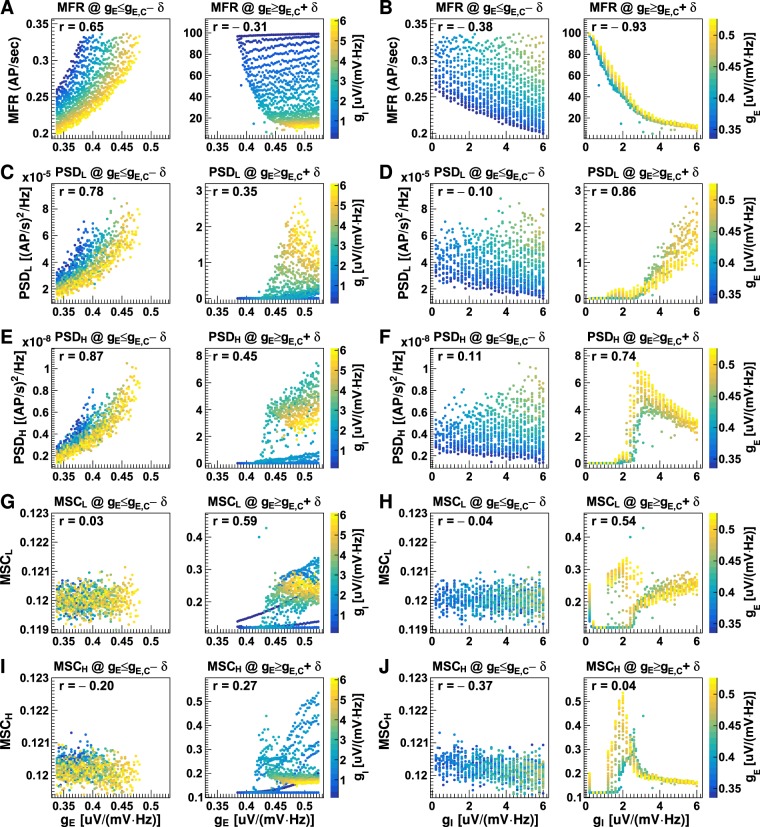
Figure 4.
Neuronal firing rate measurements plotted versus synaptic gains. Shown are the mean firing rates (MFR; (A,B)), the mean power spectrum density over 2–15 Hz (PSDL; (C and D)), the mean power spectrum density over 16–50 Hz (PSDH; (E and F)), the mean magnitude-squared coherence over 2–15 Hz (MSCL; (G,H)), the mean magnitude-squared coherence over 16–50 Hz (MSCH; (I and J)) of neuronal firing rates plotted versus excitatory gain (A,C,E,G and I) and inhibitory gain (B, D,F,H and J) for conditions when excitatory gains were smaller than the critical values (gE ≤ gE,C − δ, where δ = 0.002 uV/(mV · Hz)) and when excitatory gains were larger than the critical values (gE ≥ gE,C + δ). Each dot on the plot represents a result obtained using one synaptic gain pair. The inhibitory synaptic gain values in figure (A,C,E,G and I) and the excitatory synaptic gain values in figure (B,D,F,H and J) are represented by colour, and the corresponding colour bars are shown on the right. The Pearson’s correlation coefficient (r) was calculated for each case. The data was produced from non-stimulated datasets, as shown in Fig. 3.

