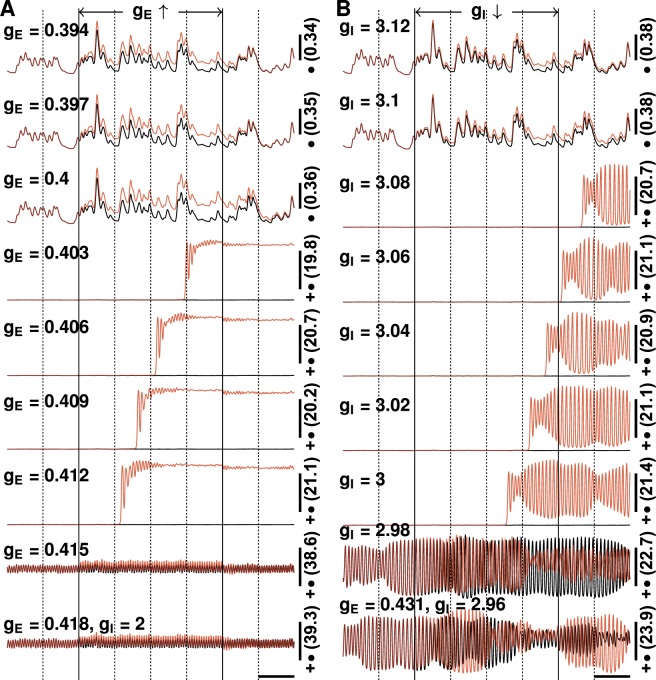
Figure 5.
Neuronal firing rates under a small transient change in synaptic gains. (A) The red lines display the firing rates when the excitatory synaptic gains, which are shown on the left, are increased by 0.015 uV/(mV · Hz) for 2 seconds (indicated by solid vertical lines). The black lines display neuronal firing rates without the change in synaptic gain. Inhibitory gains are fixed at 2 uV/(mV · Hz) and the corresponding critical excitatory gain is ~0.431 uV/(mV · Hz). (B) The red lines display the firing rates when inhibitory synaptic gains, which are shown on the left, are reduced by 0.2 uV/(mV · Hz) (i.e., weaker inhibition) for 2 seconds (indicated by solid vertical lines). The black lines display neuronal firing rates without the change in synaptic gain. The excitatory gains are fixed at 0.431 uV/(mV · Hz) and the corresponding critical inhibitory gain is about 3 uV/(mV · Hz). The number on the right is the firing rate at the middle of the vertical scale bar (unit: AP/sec), and markers represent the values of vertical scale bars: •−0.1 AP/sec, ••−0.5 AP/sec, +−5 AP/sec; +•−25 AP/sec, ++−50 AP/sec. For comparison, the same random number kernels were used for all cases.

