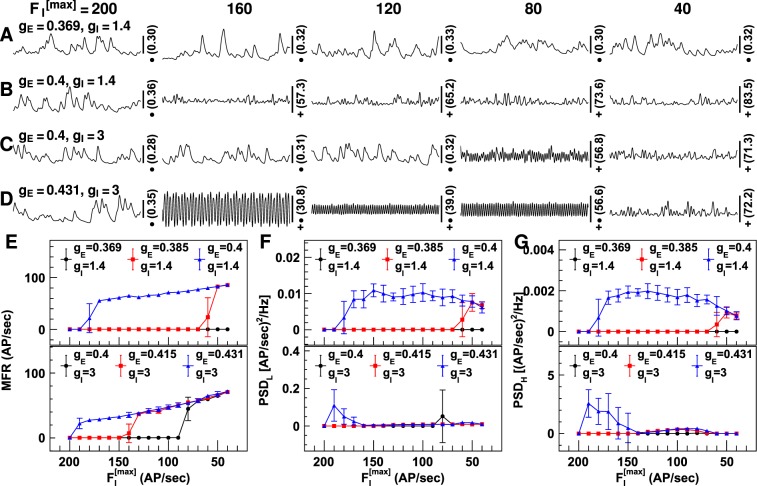
Figure 7.
Neuronal firing rates with reduced firing capability of inhibitory neuronal groups. Shown are the neuronal firing rates when the maximum firing rate of inhibitory neuron groups () is reduced. Figures (A–D) show the firing rates simulated using four combinations of synaptic gains. The synaptic gain values are shown on the left [unit: uV/(mV · Hz)] and values are shown on the top of the figures (unit: AP/sec). The number on the right is the firing rate at the middle of the vertical scale bar (unit: AP/sec), and the markers indicate the values of vertical scale bars: •−0.1 AP/sec; +−5 AP/sec; +•−25 AP/sec. The horizontal scale bars represent a 200 millisecond period. Figures (E–G) display the temporal mean firing rates (MFR; (E)), and the mean power spectrum density for firing rates of 2–15 Hz (PSDL; (F)) and 16–50 Hz (PSDH; (G)). The synaptic gain values are displayed on the top [unit: uV/(mV · Hz)]. The error bars represent the standard deviation for 10 runs of the LCM with the same parameter values but different random number kernels.

