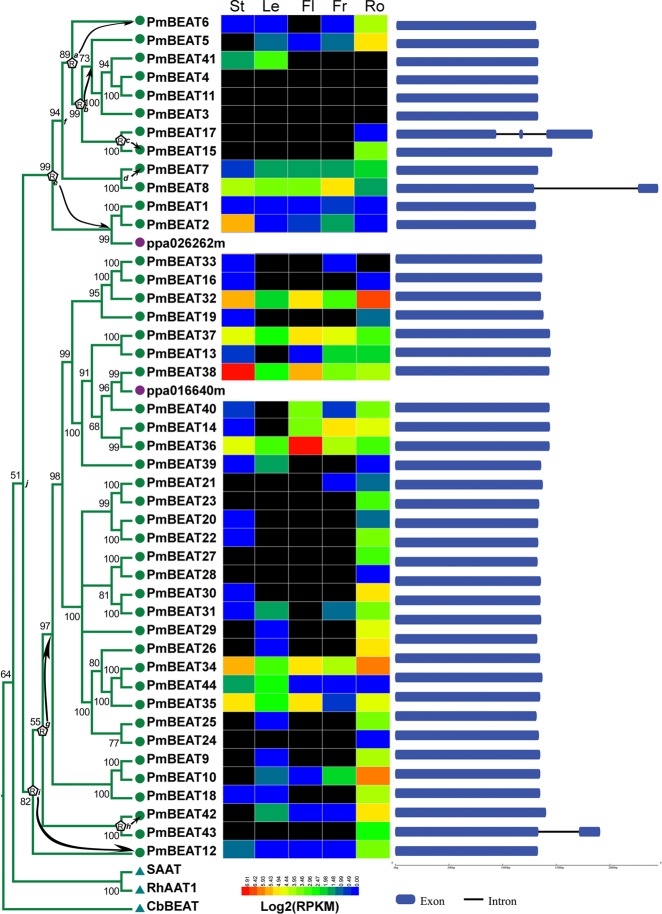
Fig. 3. Gene retroduplication, structure and expression profiling of PmBEAT genes in different organs.
The genes belonging to group I are listed. The evolutionary distances were computed using the Poisson correction method. The letter R on the nodes of the tree indicates the positions where retroduplication has occurred. Hypothesized donor genes and retrogenes in retroduplication events are connected by arrows. The colored boxes following the genes indicate their expression profiling. The color gradient from red to blue denotes expression levels from high to low. The genes with no transcription detected are in black. Five different organs are stems (St), leaves (Le), flowers (Fl), fruits (Fr), roots (Ro). In the gene structure analysis, the exons and introns are indicated by blue boxes and thin lines, respectively

