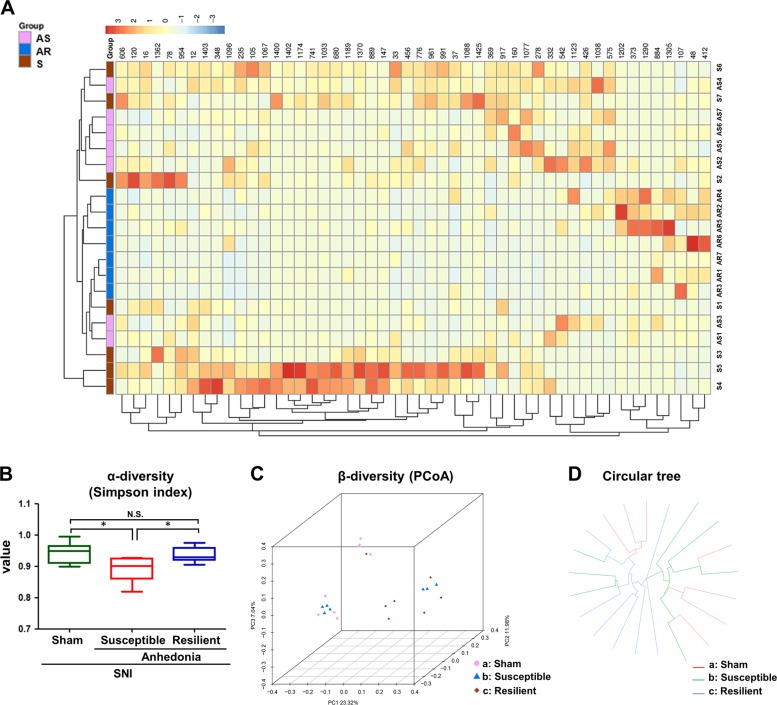
Fig. 2. Differential profiles of gut microbiota among sham, anhedonia susceptible and resilient rats after SNI.
a Heat map of different levels among the groups. b Simpson index (F2, 18 = 5.098, P = 0.018), an α-diversity indicator, among the groups. c Dendrogram of a β-diversity indicator PCoA. d Dendrogram of circular tree. α-Diversity data are shown as mean ± S.E.M. (n = 7). *P < 0.05. AS anhedonia susceptible, AR anhedonia resilient, N.S. not significant, PCoA principal coordinates analysis, S sham

