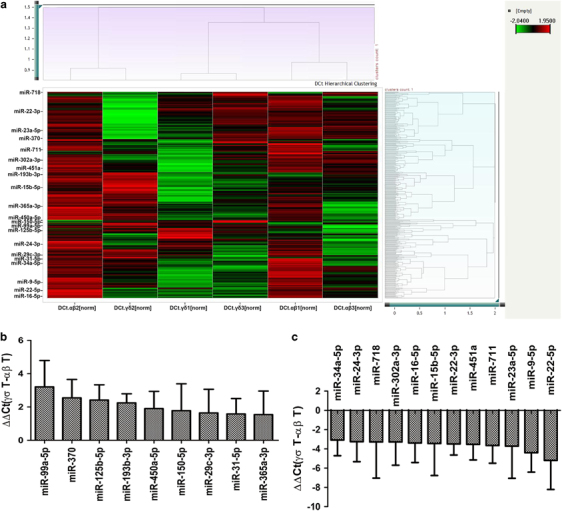
Figure 1.

Differentially expressed miRNAs between γδ T cells and αβ T cells. (a) Heat map of the correlated miRNAs between γδ T cells and αβ T cells from three donors. The ΔCt values of 347 detectors and 6 samples were analyzed by hierarchical clustering after real-time RT-PCR. (b) ΔΔCt values of the top 9 downregulated miRNAs in γδ T cells compared with αβ T cells; the ΔΔCt cutoff value was 1.5. (c) ΔΔCt values of the top 12 upregulated miRNAs in γδ T cells compared with αβ T cells; the ΔΔCt cutoff value was 3.0. Data are shown as the means±s.d.
