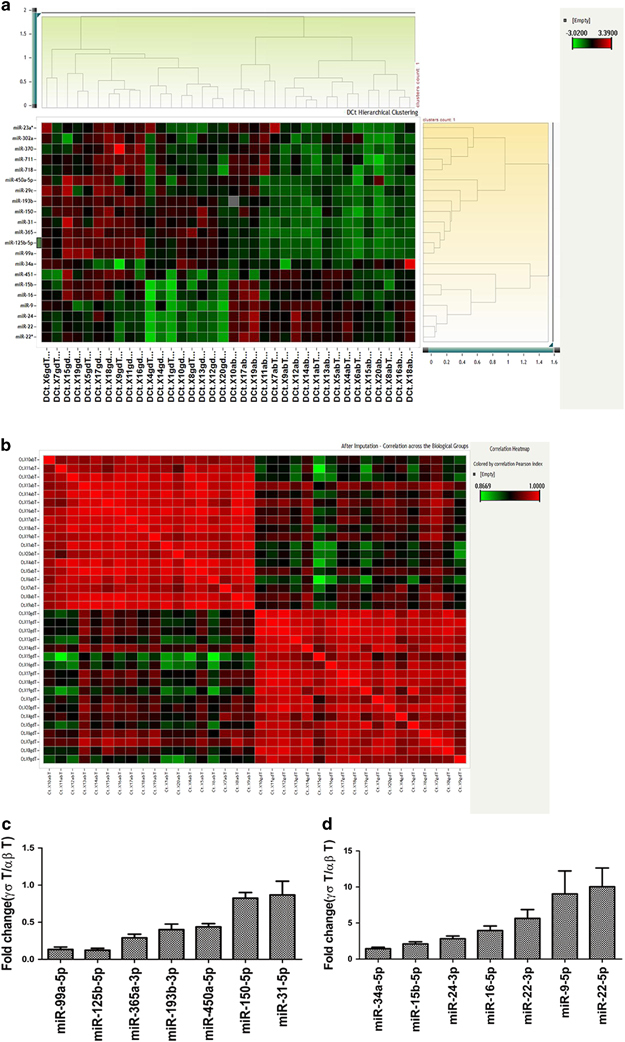
Figure 2.

Differentially expressed miRNAs between γδ T cells and αβ T cells. Differential expression was determined using the paired test (Student’s t-tests) false discovery rate (FDR) method with an adjusted P-value threshold of 0.05. (a) Hierarchical clustering of the ΔCt values of the expression of the identified miRNAs between αβ T and γδ T cells. (b) Correlation across biological groups after imputation. (c and d). Fold changes in differentially expressed miRNAs between αβ T cells and γδ T cells. (c) Downregulated miRNAs in γδ T cells. (d) Upregulated miRNAs in γδ T cells. Data are shown as the means±s.e.m.
