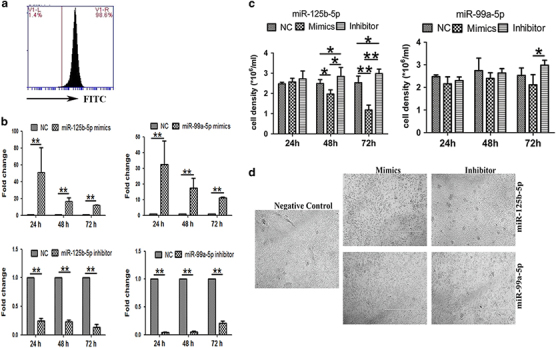
Figure 5.

γδ T-cell numbers after miR-125b-5p and miR-99a-5p overexpression and knockdown. (a) Detection of the transfection efficiency of electroporation by FITC-labeled transfection control. (b) Real-time RT PCR analysis of the transcriptional expression of miRNAs in γδ T cells transfected with miR-125b-5p and miR-99a-5p mimics or inhibitors or a negative control (NC) via electroporation. (c) Cell density analysis of living γδ T cells after removing the dead cells with the Dead Cell Removal Kit at 24, 48 and 72 h after being transfection with miR-125b-5p and miR-99a-5p mimics or inhibitors. (d) Representative images of γδ T cells at 72 h after electroporation with miR-125b-5p and miR-99a-5p mimics, inhibitors and the NC. Scale bar: 1 mm. Data are shown as the means±s.d. (n=4 independent experiments). The differences (paired Student’s t-test) were significant (*P<0.05, **P<0.01).
