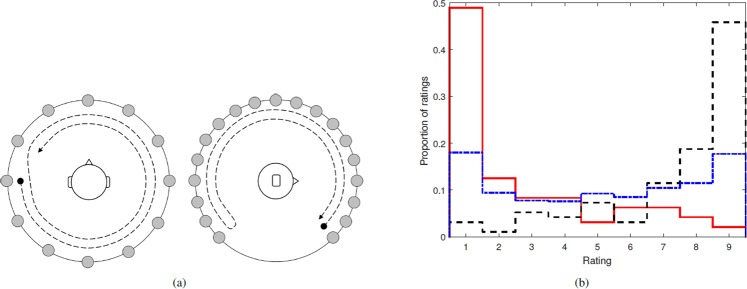
Figure 1.
Non-individual HRTF selection stimuli and results. (a) Descriptions for HRTF quality ratings: horizontal (left) and median (right) plane trajectories indicating the start/stop position and trajectory direction (•→). (b) Cumulative distribution of HRTF ratings. The distribution for ratings across all HRTFs (−⋅−). Distribution of collected individual ratings of the identified (—) worst- and (– –) best-matched HRTFs across all subjects. Distribution is normalized by the total number of ratings performed ((3× median plane + 3× horizontal plane)×16 subjects).

