Fig. 1.
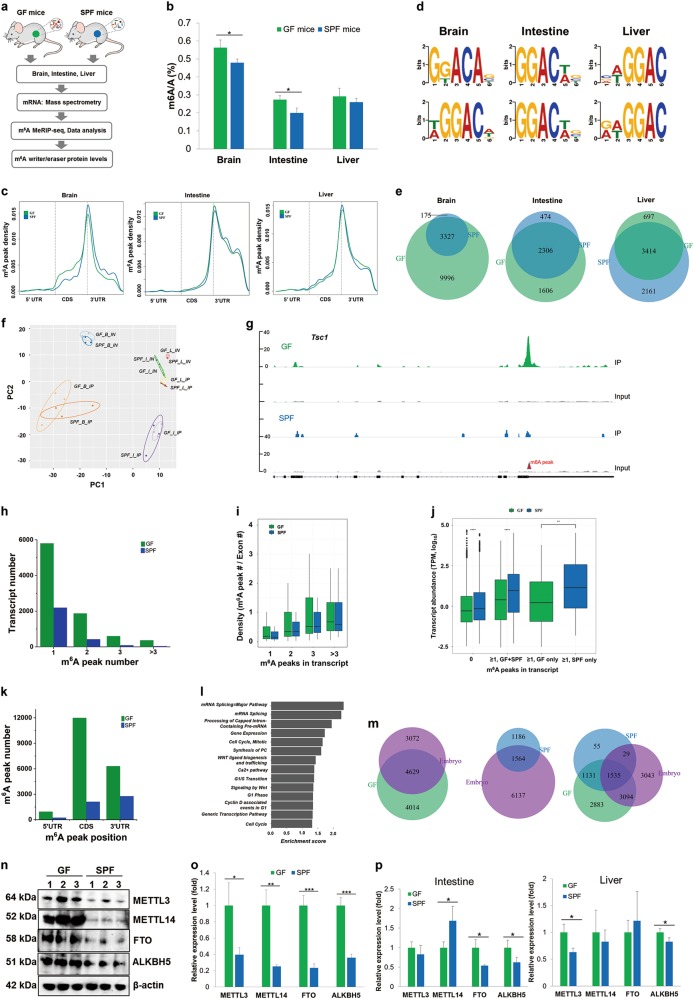
m6A methylome and writer/eraser expression in the germ-free (GF) and specific pathogen-free (SPF) mouse tissues. a Schematic representation of the study. b QQQ LC/MS measurement of total m6A/A ratio of polyA-selected and ribo-minus treated RNAs. Values are the means ± standard deviation (SD), n = 3, *P < 0.05, Student’s t-test. c m6A pattern distribution across the mRNA regions in brain, intestine and liver. m6A peaks were mapped back to the corresponding gene, and assigned as originated from 5′ UTR, coding region (CDS) or 3′ UTR. d Motif analysis of m6A peaks. Upper panel, GF tissues; lower panel, SPF tissues. e Venn diagram showing the differences of m6A peaks between GF and SPF samples. f Principal component analysis of input (IN) and IP samples. The label is for Sample_tissue_Seq, e.g., GF_B_IP stands for GF mouse, brain, m6A-IP. Tissue labels are: B, brain; I, intestine; L, liver. g Representative sequencing coverage of an mRNA in the brain showing a differential m6A peak in GF and SPF samples. h Transcript counts containing different m6A peak numbers in the brain. i m6A peak and exon density in the brain. j Abundance of m6A-containing transcripts in the brain. k mRNA m6A peak positions in the brain. l Reactome analysis of biological pathways of m6A-containing transcripts in the brain. m Venn diagram comparing the 4-week-old GF/SPF brain m6A peak-containing transcripts with those in the E13.5 embryonic brain. n Western blots of m6A writer proteins METTL3, METTL14, and eraser proteins FTO, ALKBH5 in the brain tissues. o Quantitation of m6A writer and eraser protein levels in the brain. Values are the means ± SD, n = 3, *P < 0.05, **P < 0.01, ***P < 0.001, Student’s t-test. p Quantitation of m6A writer and eraser protein levels in the intestine and liver. Values are the means ± SD, n = 3, *P < 0.05, Student’s t-test

