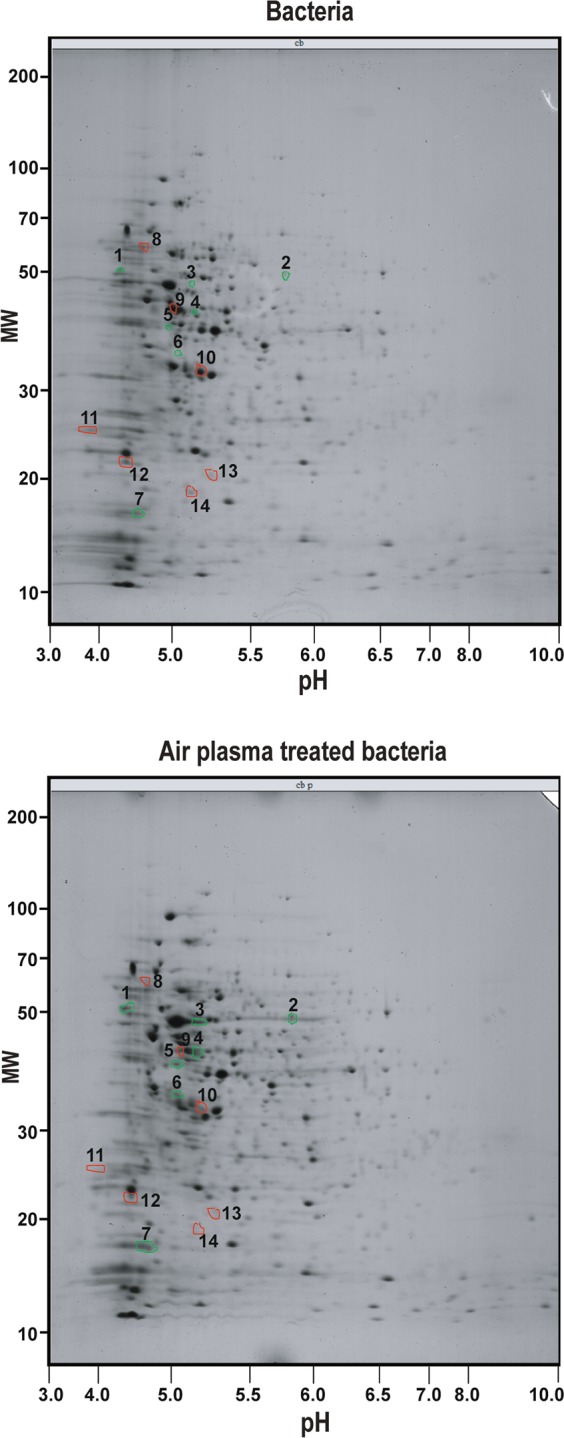
Figure 3.

Two-dimensional electrophoresis of total proteins from bacteria. Total proteins were extracted from untreated and plasma treated (air plasma for 3 min) bacteria, and then applied to two-dimensional electrophoresis. The upper and bottom gels show 2-dimentional profiles of total proteins from untreated and plasma treated bacteria, respectively. Seven protein spots in which the level was increased in plasma treated bacteria more than 3-fold are indicated in green circles (numbered as 1–7) on both gels. Seven protein spots in which the level was decreased in plasma treated bacteria more than 3-fold are indicated in red circles (numbered as 8–14) on both gels. These 14 protein spots were used for protein identification.
