Figure 2.
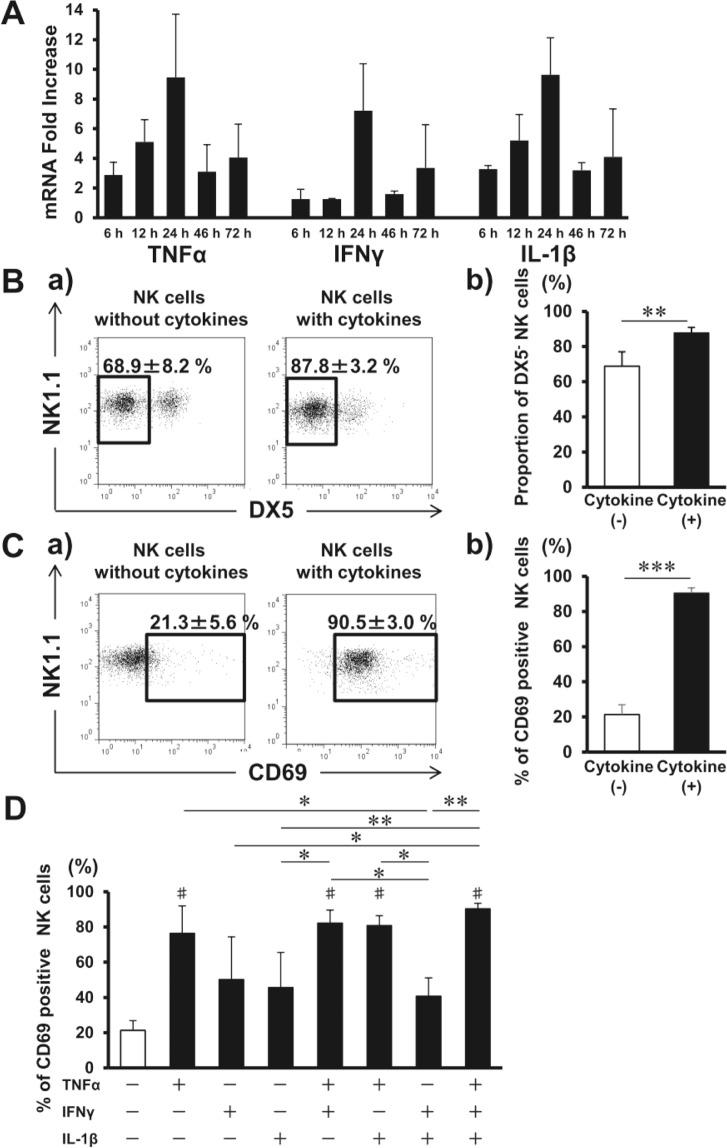
Liver natural killer (NK) cells are activated during instant blood-mediated inflammatory reaction (IBMIR). (A) Livers were harvested from C57BL/6J (B6) mice that received 300 syngeneic islets 6, 12, 24, 48, and 72 h after islet transplantation. Time course of intrahepatic mRNA for TNF-α, IFN-γ, and IL-lβ in islet transplant recipients after transplantation were compared with that of non-treated wild-type B6 mice (naive livers) as quantified by real-time RT-PCR. The relative fold increase was calculated using the delta-delta Ct method. Data are presented as the means ± standard deviation (SD) (n = 3–4). (B) Liver TCRβ− NK1.1+ NK cells were separated from liver mononuclear cells and cultured without or with TNF-α, IFN-γ, and IL-1β. Cells were harvested after 24 h and analysed with flow cytometry. Representative flow cytometry plots of NK1.1 and DX5 in isolated NK cells after the incubation without or with three cytokines. The proportions of DX5− NK cells among total NK cells are shown (n = 5). The data in bar graphs are presented as the means ± SD of 4 independent experiments. **p < 0.01. (C) Representative flow cytometry plots of NK1.1 and CD69 in isolated NK cells after their incubation without or with three cytokines. The percentages of cells expressing CD69 among total liver NK cells are shown in bar graphs as the means ± SD of 4 independent experiments (n = 5). ***p < 0.001. (D) Liver NK cells treated with the cytokine combinations for 24 h (n = 4–5). The data in bar graphs are presented as the means ± SD of 4 independent experiments. *p < 0.05; **p < 0.01. #p < 0.001, compared with the results of liver NK cells without cytokines.

