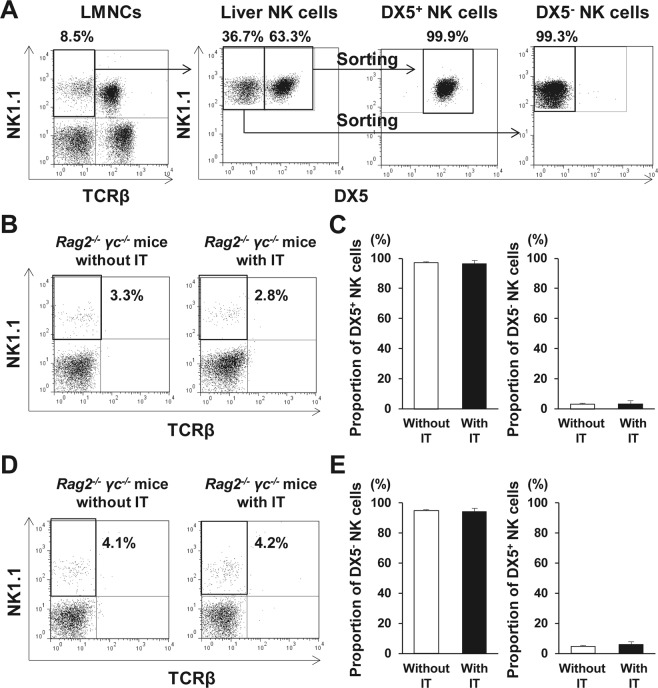
Figure 4.
Propagation of liver DX5− natural killer (NK) cells in response to islet transplantation (IT). (A) TCRβ− NK1.1+ DX5+ NK cells and DX5− NK cells were isolated from liver mononuclear cells (LMNCs) of C57BL/6 (B6) wild-type mice. Representative dot plots show the isolated DX5+ NK cells and DX5− NK cells. (B) Isolated DX5+ NK cells were transferred into B6 Rag-2−/− γ chain−/− mice, which was followed by IT, after which LMNCs from the recipient mice were analysed. Representative dot plots show the gated TCRβ− NK1.1+ NK cells and their percentage in total liver NK cells from DX5+ NK cell-transferred recipients with/without IT. (C) Bar graph, representing the mean percentage ± standard deviation (SD) of each subset of NK cells in total NK cells isolated from B6 Rag-2−/− γ chain−/− mice that received DX5+ NK cells, followed or not by IT (n = 5). Data were collected from of 2 independent experiments. (D) Isolated DX5− NK cells were transferred into B6 Rag-2−/− γ chain−/− mice, which was followed by IT, after which LMNCs from the recipient mice were analysed. Representative dot plots show the gated TCRβ− NK1.1+ NK cells and their percentage in total liver NK cells from DX5− NK cell-transferred recipient with/without IT. (E) Bar graph, representing the mean percentage ± SD of each subset of NK cells in total NK cells isolated from B6 Rag-2−/− γ chain−/− mice that received DX5− NK cells, followed or not by IT (n = 5). Data were collected from of 2 independent experiments.

