Figure 2.
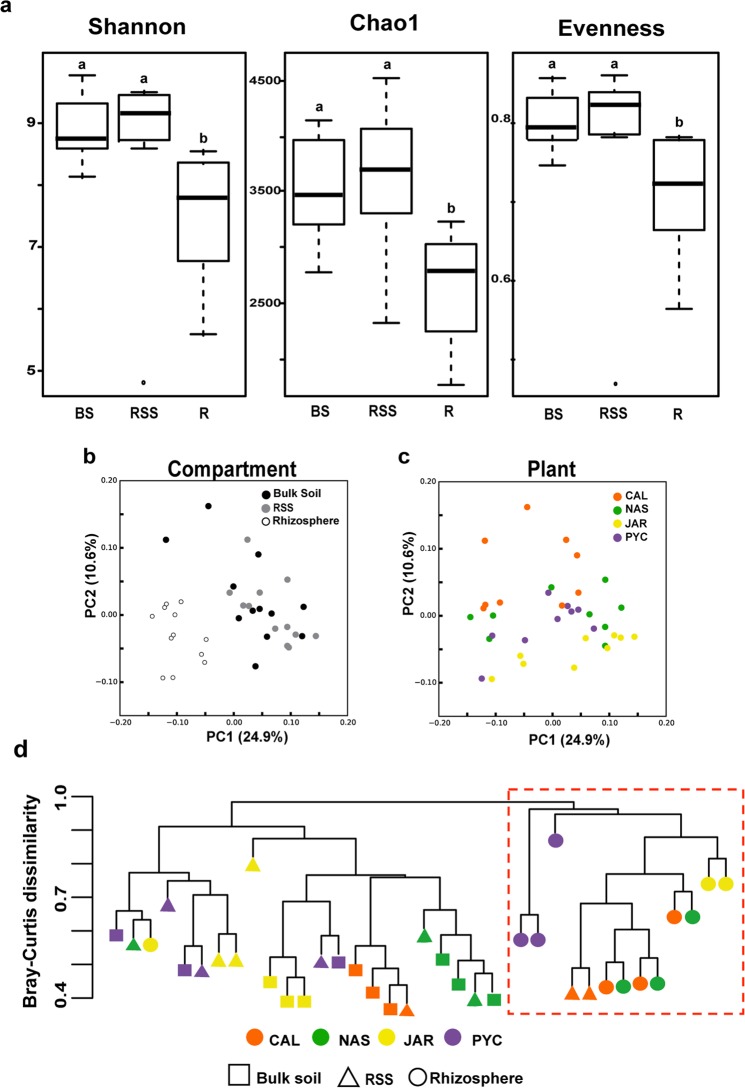
Structure and taxonomic composition of bacterial communities in the three soil compartments. (a) Alpha-diversity indicates a decreasing gradient in bacterial diversity from the bulk soil to the rhizosphere. Horizontal bars within boxes represent median. The tops and bottoms of boxes represent 75th and 25th quartiles, respectively. All outliers are plotted as individual points. BS: Bulk soil; RSS: rhizosphere-surrounding soil; R: Rhizosphere. a,bBars with different letters indicate statistically significant differences (Dunn’s test). (b) Principal coordinates analysis (PCoA) of bacterial communities based on the unweighted UniFrac distance matrix, as affected by soil compartment, and (c) plant species. (d) Bray-Curtis dissimilarity using all OTUs relative abundances present in all samples. The red square points out the cluster formed almost exclusively by rhizospheric samples.

