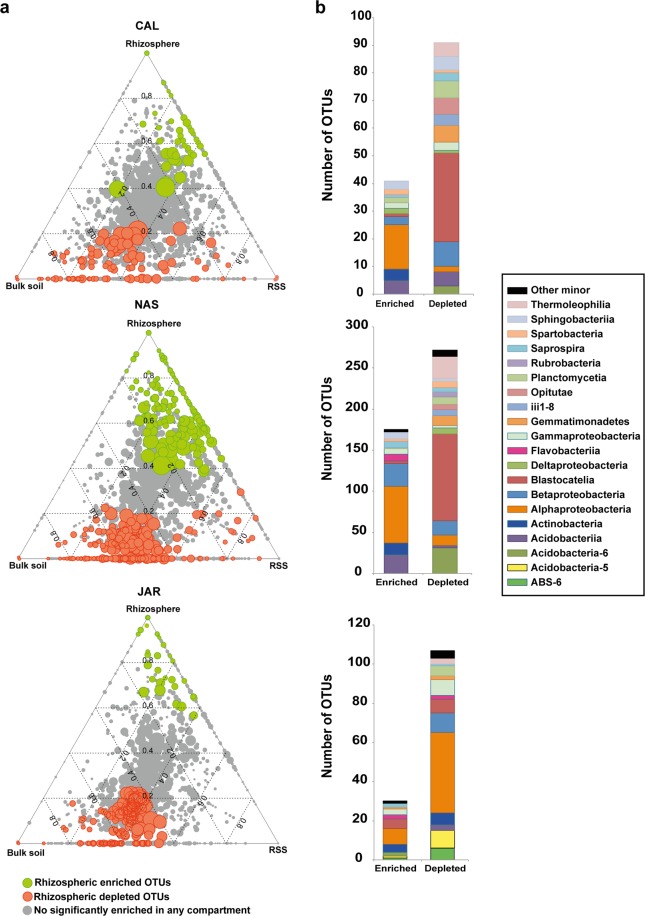
Figure 5.
OTU enrichment and depletion in the rhizosphere. (a) Ternary plot representing all OTUs in the data set with relative abundance >0.03% in at least one sample (~80% of the total abundance). Dot size represents its mean relative abundance (weighted average) and their position is determined by the contribution of each compartment to its total relative abundance. The dotted grid and numbers inside the triangle indicate 20% increments of contribution from each compartment. Green dots represent OTUs significantly enriched in the rhizosphere. Orange dots represent OTUs significantly depleted in the rhizosphere (FRD; p < 0.05 in both cases). Gray dots represent OTUs not significantly enriched or depleted. (b) Histograms indicating the taxonomy (class level) of all enriched and depleted OTUs. Only those classes with at least three OTUs in one category (enriched or depleted) are represented. CAL: Calamagrostis crispa, NAS: Nassella nardoides, JAR: Jarava frigida, PYC: Pycnophyllum bryoides.

