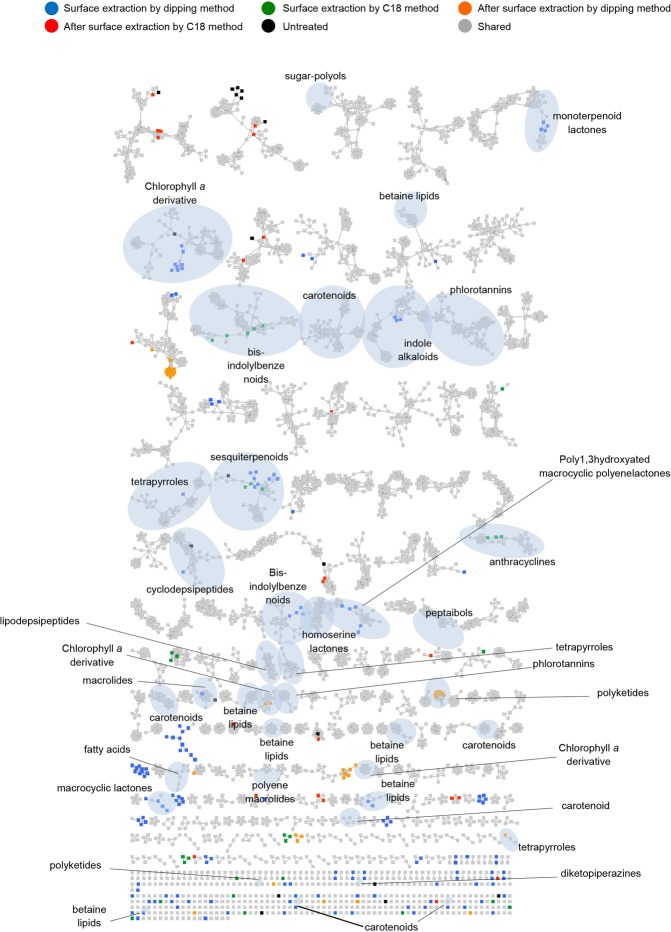
Figure 6.
Visualization of the metabolome of different F. vesiculosus extracts by molecular networks: Putatively known metabolites were dereplicated and highlighted. Node colours represent different extracts (Blue: FVAI, Green: FVAII, Orange: FVBI, Red: FVBII, Black: FVC and Grey: shared metabolites). Nodes originating from solvent blanks (i.e. MeOH or hexane:MeOH mixture that was evaporated, dissolved in MeOH and injected to UPLC-MS/MS under the same conditions as the algal extract samples) were subtracted.

