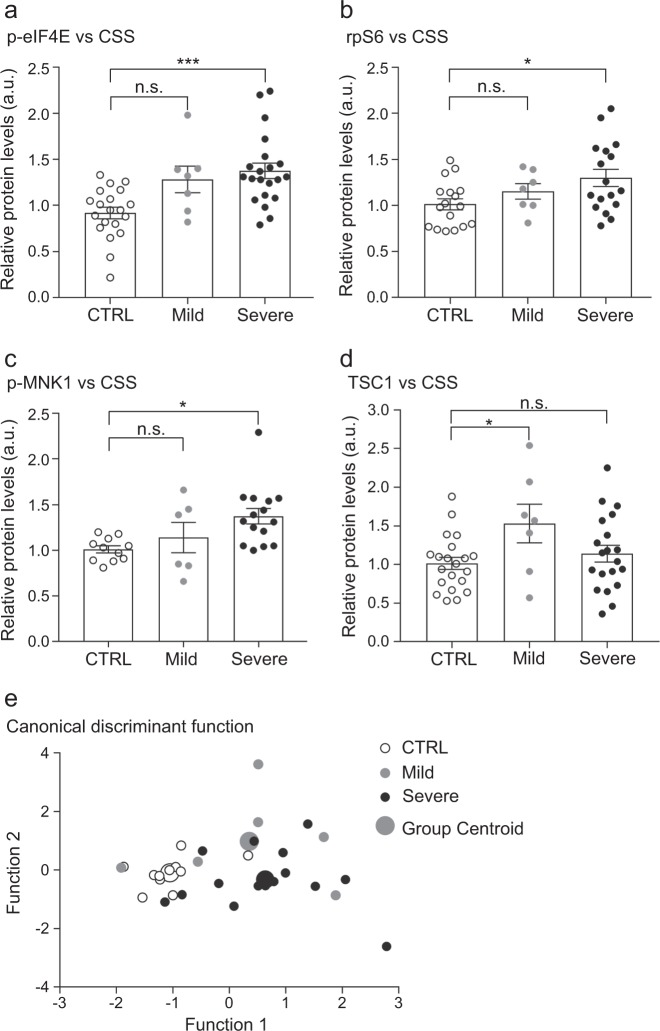
Fig. 2. Protein levels in PBMCs correlate with the severity of the clinical phenotype.
Bar plots representing the quantification of the technical replicates in the three subgroups, CTRL, Mild ASD and Severe ASD show significantly increased levels of a p-eIF4E (F(2,45) = 9.51; p = 0.0004) b rpS6 (F(2,38) = 3.70; p = 0.03) and c p-MNK1 (F(2,29) = 5.02; p = 0.01) in the severe subgroup compared to controls, while d TSC1 levels were significantly increased in the mild group only (F(2,45) = 3.24; p = 0.048). Error bars represent the standard error of the mean (n = 11-21 CTRL, 6-7 Mild ASD, 11-20 Severe ASD; *p < 0.05, **p < 0.01, ***p < 0.001; one-way ANOVA). e Scatter plot of the two canonical functions containing four proteins (p-eIF4E, rpS6, TSC1, p-MNK1) that discriminated subjects according to their severity into three groups: CTRL, mild ASD and severe ASD (Wilks’ Lambda = 0.480; Chi-square = 20.2; df = 8; p = 0.01). The mean discriminant scores for each group are depicted as group centroids. Four patients were not included in this analysis (see Table 1)

