Fig. 3.
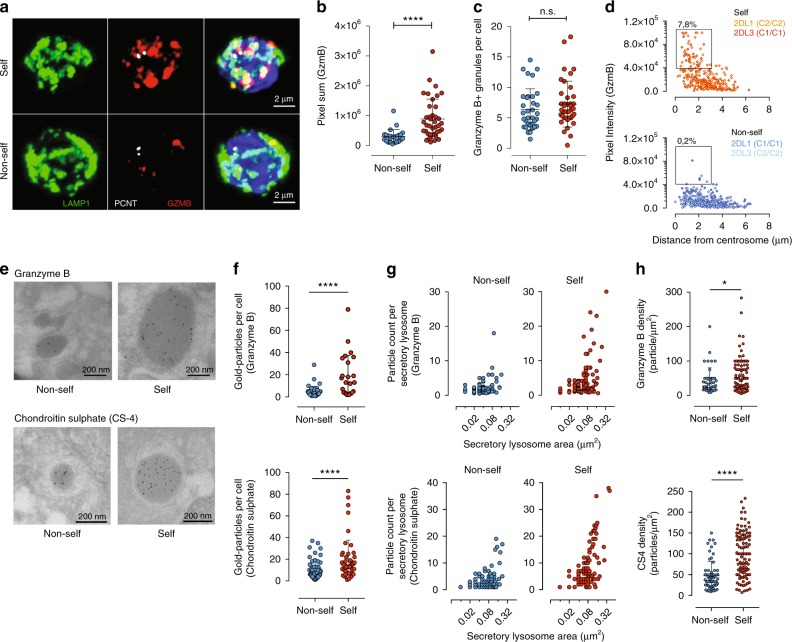
Modulation of the lysosomal compartment in educated NK cells. a Confocal microscopy Z-stack showing Pericentrin (PCNT), LAMP-1, and granzyme B (GZMB) staining in sorted mature CD56dim NKG2A−NKG2C−CD57− NK cells expressing non-self or self KIR. Scale bar is 2 μm. b The pixel sum of granzyme B staining in cells expressing non-self or self KIR. c The number of LAMP-1+ lysosomal structures. Data in panels (b) and (c) are aggregated from sorted 2DL1 and 2DL3 single-positive NK cell subsets from C1C1 (n = 5 donors) and C2C2 (n = 5 donors) donors. d Granzyme B expression levels versus the distance from the centrosome in individual lysosomes in sorted NKG2A−NKG2C−CD57− NK cells expressing non-self or self KIR (n = 804 lysosomes from 3 donors were analyzed). Gates were set based on visual inspection to quantify the percentage of granzyme-B dense secretory lysosomes in self and non-self NK cells. e Representative immuno-EM section showing staining with gold-particle coated anti-granzyme B (top) and Chondroitin Sulphate-4 (CS-4) (bottom) of sorted CD56dim NKG2A−NKG2C−CD57− NK cells expressing non-self or self KIR. Scale bar is 200 nm. f Number of gold particles (granzyme B and CS-4) per cell. (non-self n = 83 cells, self n = 109 cells). g Particle count (granzyme B and CS-4) as a function of the lysosomal area. h Density of gold particles (granzyme B and CS-4) per lysosomal area (μm2). Immuno-EM data are from 5 donors and 5 experiments. Paired t-tests were performed in panels (b, c, e, and g). ****p < 0.0001 and *p < 0.05. Red and blue circles and box plots represent NK cells with self or non-self KIR, respectively

