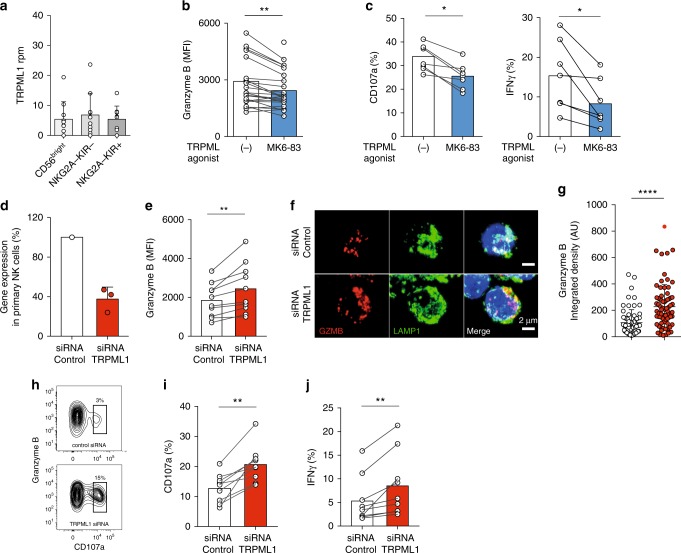
Fig. 7.
TRPML1-mediated modulation of secretory lysosomes. a mRNA expression (RNA-Seq) of TRPML1 in the indicated NK cell subsets sorted from PBMC and analyzed directly. b Granzyme B expression in NK cells treated for 2 h with 10 μM of the TRPML1 agonist MK6-83. (Summary of n = 23 donors.) c Degranulation (left) and IFNγ responses (right) by resting primary NK cells following stimulation with K562 cells for 4 h in the presence or absence of 10 μM MK6-83. Data are the summary from two independent experiments with 7 donors. d Relative mRNA expression (qPCR) of TRPML1 72 h after siRNA silencing in NK cells cultured for 3 days in 1 ng/mL IL-15. e Granzyme B expression in NK cells 72 h after siRNA silencing of TRPML1. f Confocal microscopy image showing LAMP-1 and granzyme B (GZMB) staining in siRNA TRPML1 silenced NK cells. Scale bar is 2 μm. g Summary of integrated granzyme B intensity per cell as quantified with ImageJ (n = 3 experiments). AU arbitrary units. h Representative example of FACS plot showing granzyme B expression versus CD107a in siRNA TRPML1 silenced NK cells after 4-h stimulation with K562 cells. Compiled data on i CD107a and j IFNγ production in TRPML1-silenced primary NK cells. Data are from nine donors with confirmed siRNA silencing. Paired t-tests were performed in panels (b, c, e, i, and j). Non-paired t-test was performed in panel (g). Whiskers show 5th to 95th percentile. Bars show the median. ****p < 0.0001; **p < 0.01; and *p < 0.05. Red and blue box plots represent NK cells treated with the indicated compounds or siRNA

