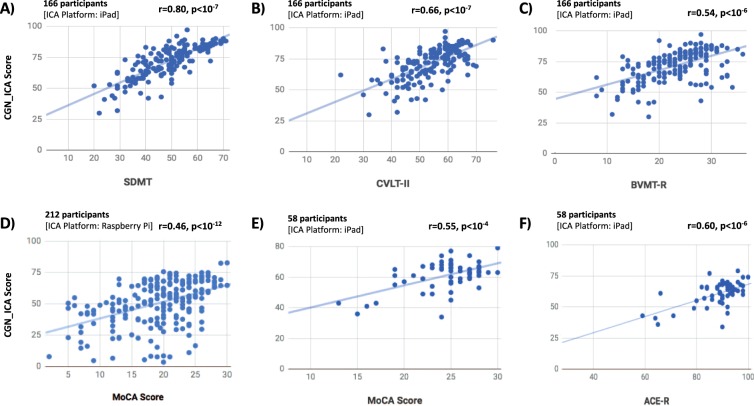
Figure 2.
The CGN_ICA test score is significantly correlated with a wide range of standard cognitive tests. Participants have taken the CGN_ICA test along with one or more standard cognitive tests (see Table 1). Each scatter plot shows the ICA score (y axis) vs. one of the standard cognitive tests (x axis). Each blue dot indicates an individual; the lines are results of linear regression, fitting a linear line to the data in each plot. For each plot, number of participants who have taken the tests and platform on which the CGN_ICA is taken are written on top of the scatter plot. ‘r’ and ‘p’ on top-right corner of each plot show the Pearson correlation between the two candidate tests, and the p-value of the correlation, respectively.

