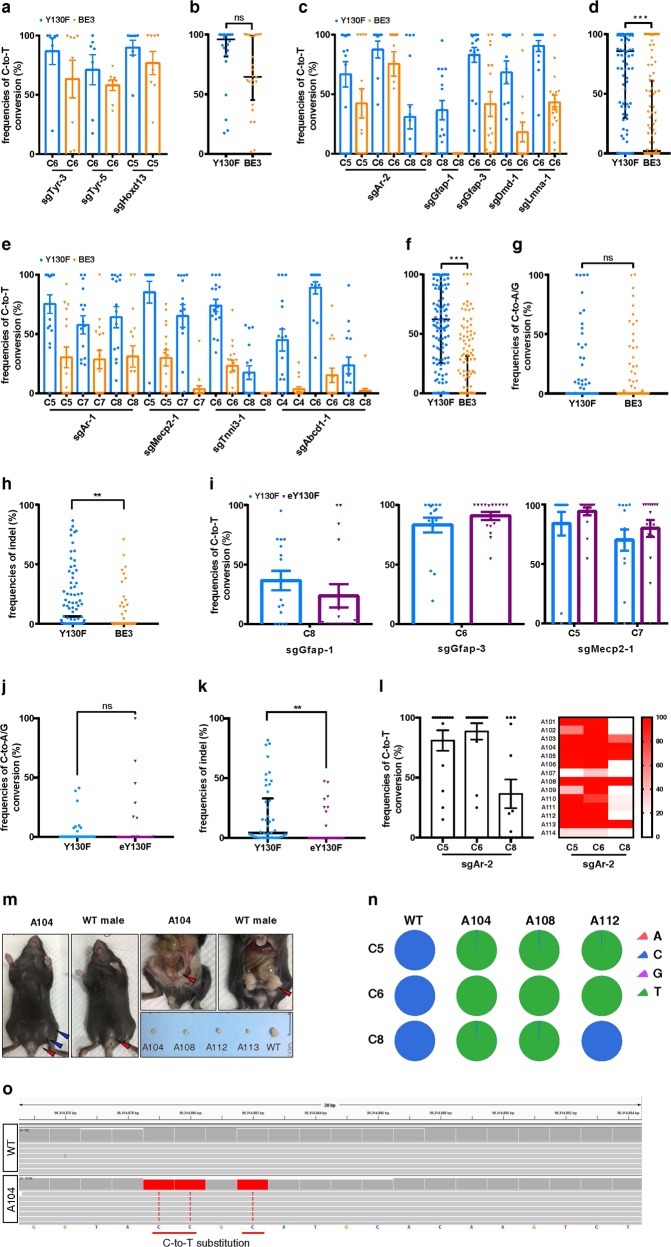
Fig. 1.
hA3A-BE3-Y130F induces efficient C-to-T base editing in vivo. a, c, e Comparison of C-to-T editing efficiency induced by hA3A-BE3-Y130F and BE3 in the target regions having no GpC site (a), one GpC site (c), or two or three GpC sites (e) within the editing window in mouse embryos. Mean ± s.e.m. were from at least seven independent experiments. b, d, f Statistical analysis of the C-to-T editing frequency induced by hA3A-BE3-Y130F and BE3 in (a), (c), (e), respectively. n = 22 for hA3A-BE3-Y130F and n = 24 for BE3 (b), n = 79 for hA3A-BE3-Y130F and n = 80 for BE3 (d), and n = 62 for hA3A-BE3-Y130F and n = 64 for BE3 (f). g, h Statistical analysis of non-C-to-T base conversions (g) and indels (h) induced by hA3A-BE3-Y130F and BE3 in all embryos. n = 163 for hA3A-BE3-Y130F and n = 168 for BE3. i Comparison of C-to-T editing efficiency induced by hA3A-BE3-Y130F and hA3A-eBE-Y130F in the target regions having GpC dinucleotides in mouse embryos. Mean ± s.e.m. were from at least twelve independent experiments. j, k Statistical analysis of non-C-to-T base conversions (j) and indels (k) induced by hA3A-BE3-Y130F and hA3A-eBE-Y130F in mouse embryos. n = 46 for hA3A-BE3-Y130F, n = 44 for hA3A-eBE-Y130F. l C-to-T editing efficiency within the editing window induced by hA3A-BE3-Y130F and sgAr-2 in founder mice is displayed in column graph (mean ± s.e.m. were from fourteen founder mice) and heatmap. m Sexual reversal was observed in AIS-modeling founder mice. Left: A 4-week-old mouse (Founder A104) with female genitalia (red arrowhead) and nipples (blue arrowheads) and WT male with normal genitalia (red arrowhead); Right upper: Founder A104 with internal genitalia of male (red arrowhead) and smaller testis, and WT male with normal genitalia of male (red arrowhead); Right lower: Genitalia of Founders A104, A108, A112, A113, and WT male. n Base-editing product purities in Founder A104, A108, and A112 were determined by deep sequencing. o Confirmation of the on-target base editing by analyzing the whole-genome sequencing results of A104. b, d, f–h, j, k The median and interquartile range (IQR) are shown. *P < 0.05; **P < 0.01; ***P < 0.001; ns not significant, Student’s two-tailed t-test

