Fig. 7.
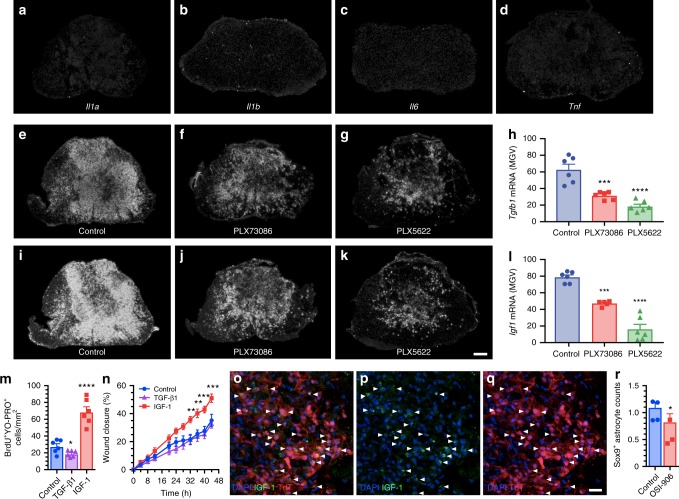
Microglia-derived IGF-1 is a potent mitogen for astrocytes and inducer of astrocytic migration towards an injured area. a–d In situ hybridization (ISH) signal for the proinflammatory cytokines IL-1α, IL-1β, IL-6, and TNF in the injured mouse spinal cord (lesion epicenter) at 7 days post-SCI (dpi). e–g, i–k Representative darkfield photomicrographs showing expression of Tgfb1 and Igf1 mRNAs at the lesion epicenter at 7 dpi in C57BL/6 mice fed the control diet, PLX73086 or PLX5622. h, l Quantification of ISH signal (in mean grey values, MGV) for TGF-β1 (h) and IGF-1 (l) at the lesion epicenter in mice treated with vehicle (Control, blue bars), PLX73086 (red bars) or PLX5622 (green bars) (n = 6 per group). m Quantification of the number of BrdU+ YO-PRO-1+ nuclear profiles following treatment of primary astrocyte cultures with either TGF-β1, IGF-1 or control solution (n = 6 per group). n Quantification of the wound closure response in the different groups (n = 6 per group). o–q Representative immunofluorescence images showing the expression of IGF-1 (green signal, o, p) by TdT+ microglia (red cells, o and q) accumulating at the lesion border at 7 dpi. White arrowheads indicate co-localization of IGF-1, TdT, and DAPI (blue). r Quantification of Sox9+ astrocytes, expressed as the AUC of the total number of Sox9+ cells (×103 per mm3) from 800 µm rostral to 800 µm caudal to the epicenter, in the injured spinal cord of C57BL/6 mice treated with the IGF-1R antagonist OSI-906 (red bar) or the vehicle solution (Control, blue bar) (n = 4 per group). Data are expressed as mean ± SEM. *p < 0.05, **p < 0.01, ***p < 0.001, ****p < 0.0001, compared to the control group. Statistical analysis was performed using either a one-way (h, l, and m) or two-way (n) ANOVA followed by a Bonferroni’s post hoc test, or a Student’s t-test (r). Scale bars: (a–g and i–k, in k) 200 µm, (o–q, in q) 20 µm

