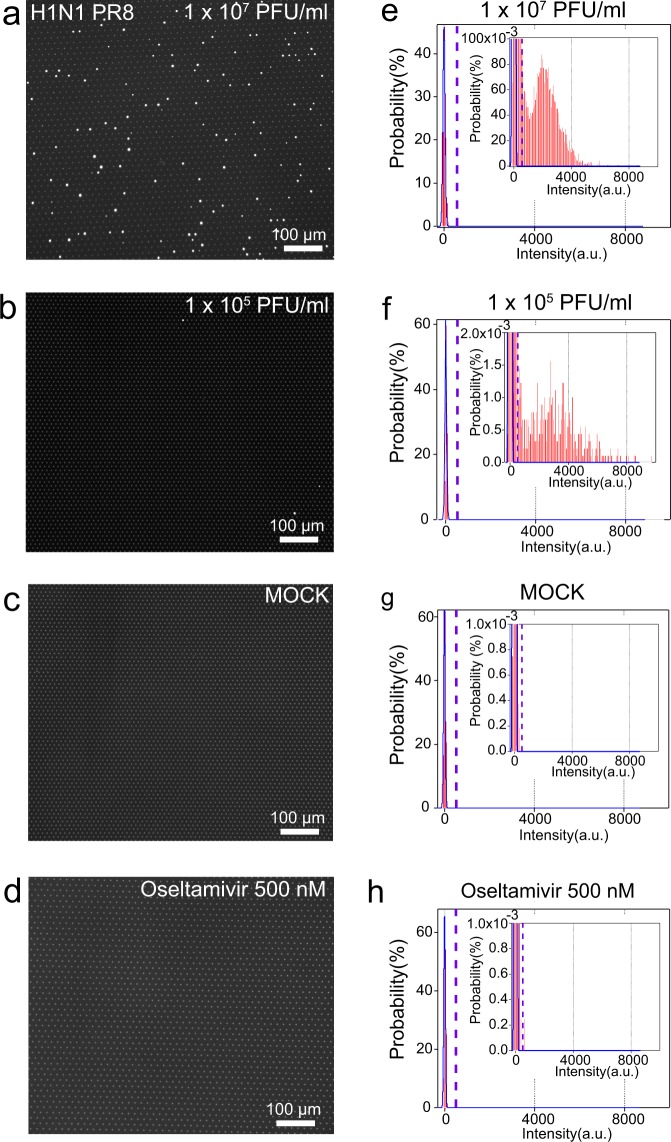
Figure 2.
Fluorescence images of DIViC and distribution of fluorescence intensity. (a–d) Representative fluorescence images obtained in DIViC at different titres with 1 mM MUNANA. (e–h) Distribution of the fluorescence intensity of microdroplet reactors, with insets for the expanded graph. The blue lines indicate fits to the normal distribution to the first peak corresponding to empty reactors. The dotted lines show the threshold lines to discriminate positive reactors from empty ones. (a,e), and (b,f), Influenza virus (A/Puerto Rico(PR)/8/1934(H1N1)) 1.0 × 10⁷ and 1.0 × 10⁵ PFU/mL with 1 mM MUNANA. (c,g), Mock sample. Madin–Darby canine kidney (MDCK) cells without viruses. (d,h), Influenza virus (A/PR/8/1934(H1N1)) 5.0 × 10⁶ PFU/mL with 500 nM oseltamivir.

