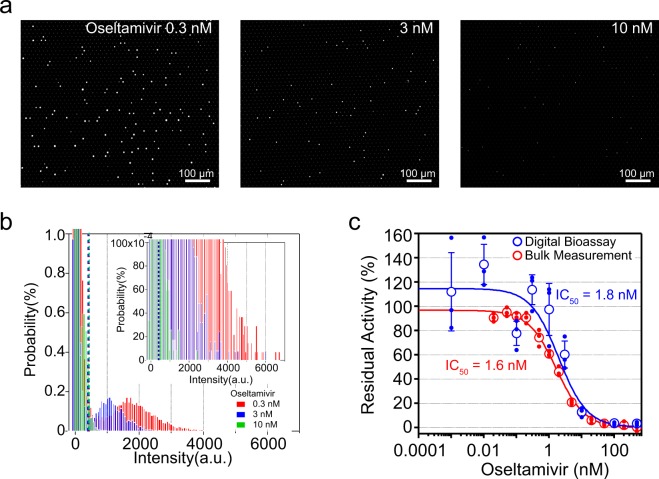
Figure 5.
Inhibition assay with oseltamivir. (a) Representative fluorescence images of DIViC of influenza A virus (A/PR/8/1934(H1N1)) at 5.0 × 10⁶ PFU/mL with 0.3 nM, 3 nM or 10 nM oseltamivir. (b) Distribution of the fluorescence intensity with 0.3 nM (red), 3 nM (blue) or 10 nM (green) oseltamivir. Red, blue and green dotted lines indicate the threshold lines to define positive reactors at 0.3 nM, 3 nM and 10 nM oseltamivir, respectively. The top-right insets show expanded graph. c, Residual activity versus oseltamivir concentration. Red and blue filled circles indicate the residual activity measured in bulk experiments and DIViC, respectively. Open circles indicate average residual activity. Error bars represent the standard deviation. Data points were fitted according to competitive inhibition model to determine the half-maximal inhibitory concentrations (IC50) to be 1.6 nM for bulk measurements and 1.8 nM for DIViC.

