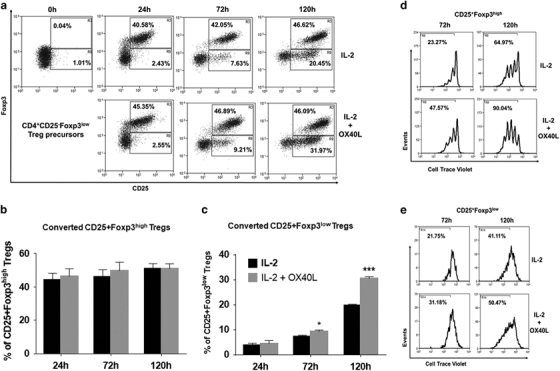
Figure 5.

Effects of OX40L treatment on CD25−Foxp3low Treg precursors. (a) CD25-Foxp3low Treg precursors sorted from Foxp3.eGFP murine CD4+SP thymocytes were labelled with Cell Trace Violet and cultured with IL-2 (top panel) or IL-2+OX40L (bottom panel) for 0–120 h, as described for a. Numbers within dot plots represent percentages of CD25+Foxp3high (Upper gate) and CD25+Foxp3low (lower gate) Tregs differentiated from CD25−Foxp3low precursors. (b) Bar graph showing the percentages of CD25+Foxp3high Tregs in IL-2- (black) and OX40L+IL-2 (gray)-treated cultures (c) Bar graph showing the percentages of CD25+Foxp3low Tregs in IL-2- (black) and OX40L+IL-2 (gray)-treated cultures (values represent means±SEM, n=3, *p<0.05, ***p<0.005 vs IL-2). (d) Histogram showing the percentages of proliferating cells within CD25+Foxp3high Tregs in IL-2- (top) vs IL-2+OX40L (bottom)-treated cultures at 72 h and 120 h. (e) Histogram showing the percentages of proliferating cells within CD25+Foxp3low Tregs in IL-2- (top) vs IL-2+OX40L (bottom)-treated cultures at 72 h and 120 h. Treg, regulatory T cells.
