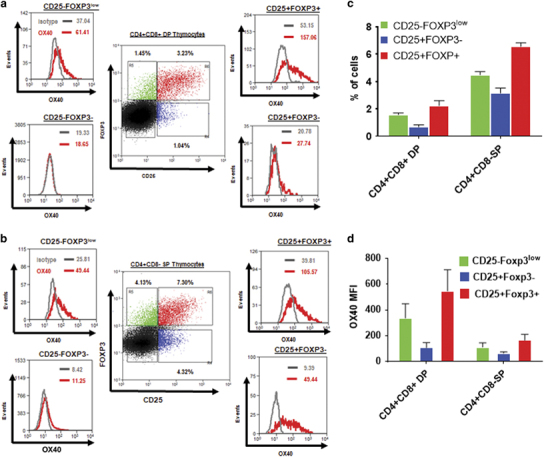
Figure 7.

Human thymic Treg precursors and mature Tregs express OX40. (a,b) CD25+Foxp3− (blue) and CD25−FOXP3low (green) Treg precursors and CD25+FOXP3+ (red) mature Tregs were gated from CD4+CD8+ DP (a) and CD4+CD8-SP (b) human thymocytes, and OX40 expression in the respective populations is shown in the histograms. Numbers in dot plots represent percentages of the indicated subsets in gated CD4+CD8+DP and CD4+ SP thymocytes. Numbers in histograms represent MFI values of OX40 (red) and isotype (gray) control. (c). Bar graph showing the frequencies of CD25−FOXP3low (green), CD25+FOXP3− (blue) and CD25+FOXP3+ (red) subsets within CD4+CD8+ DP and CD4+CD8−SP thymocytes from human thymi (values represent means±SEM, n=6). (d) Bar graph showing MFI values of OX40 expression in CD25−FOXP3low (green), CD25+FOXP3− (blue) and CD25+FOXP3+ (red) subsets within CD4+CD8+ DP and CD4+CD8−SP thymocytes. SP, single positive; Treg, regulatory T cells.
