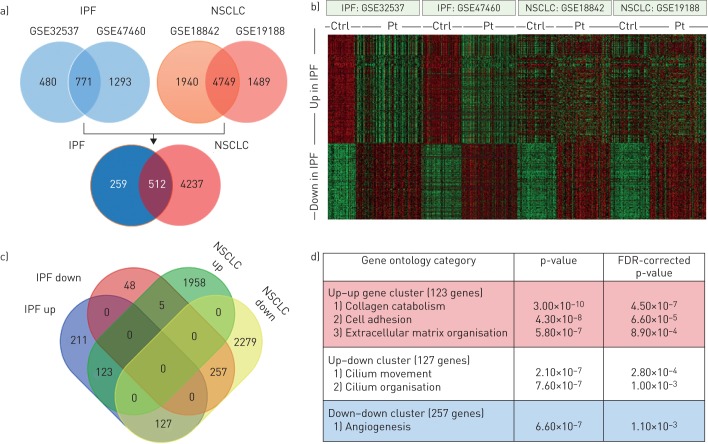
FIGURE 1.
Comparison between idiopathic pulmonary fibrosis (IPF) and non-small cell lung cancer (NSCLC) transcriptomes. a) Venn diagrams showing the overlap in differently expressed genes (false discovery rate (FDR)-corrected p-values <0.05 and a fold change >1.5) in the GSE32537 and GSE47460 IPF datasets (upper left), the GSE18842 and GSE19188 NSCLC datasets (upper right) and the overlap in differentially expressed IPF and NSCLC genes (lower Venn diagram). b) Heatmap of the 771 genes differently regulated genes in IPF (455 upregulated and 316 downregulated) in the different IPF and NSCLC datasets. Green denotes low expression and red denotes high expression. c) Venn diagram of the 512 genes differentially expressed both in the IPF and NSCLC datasets showing that 123 genes were upregulated in both IPF and NSCLC, 257 genes were downregulated in both IPF and NSCLC, 127 genes were upregulated in IPF but downregulated in NSCLC and five genes were downregulated in IPF but upregulated in NSCLC. d) Gene ontology enrichment analysis of the different (i.e. upregulated–upregulated, upregulated–downregulated and downregulated–downregulated for IPF and NSCLC) gene signatures. Ctrl: control; Pt: patient.

