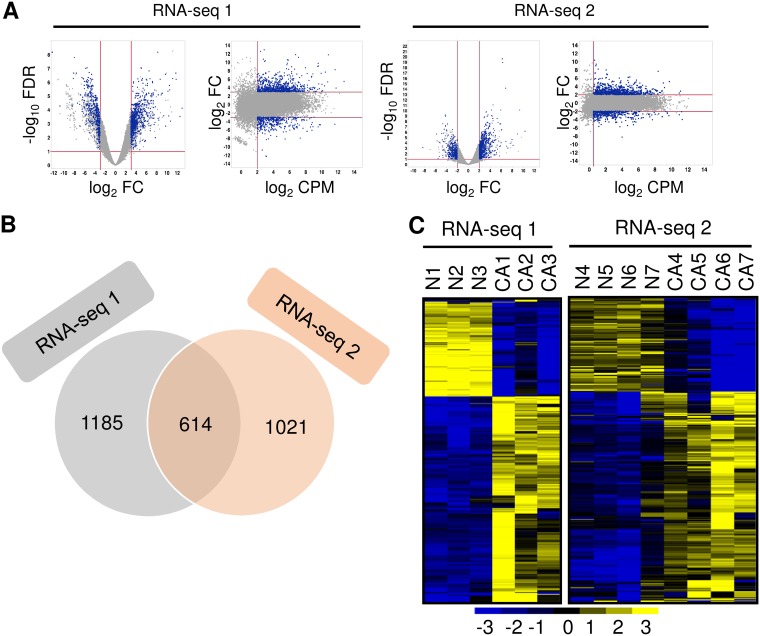
FIG 1.
The transcriptomic signatures of normal cervix versus cervical cancer. (A) Smear plot visualization of differential expression analyses of cancer versus normal transcriptomes in RNA-seq 1 and RNA-seq 2. Transcripts used for the Venn diagram presented in panel B are highlighted in blue. FC, fold change; FDR, false-discovery rate; CPM, counts per million. (B) Venn diagram depicting the overlapped gene transcripts differentially expressed between RNA-seq 1 and RNA-seq 2. (C) Heat maps showing 614 overlapped, differentially expressed gene transcripts with normalized expression values crossing all normal cervical tissue samples and cervical cancer tissue samples. Left, RNA-seq 1; right, RNA-seq 2.

