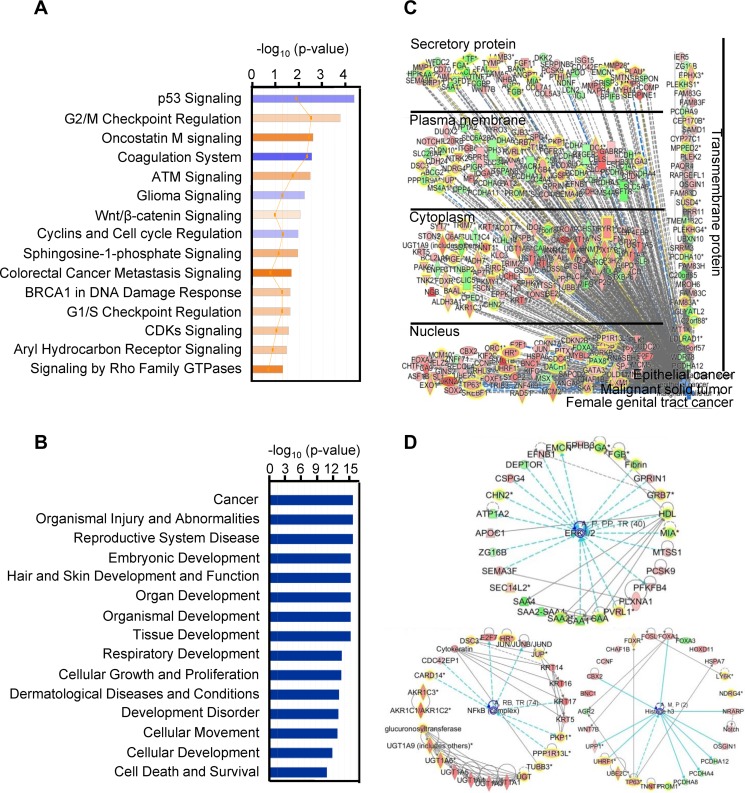
FIG 2.
IPA enrichment analysis of the 614 gene transcripts with differential changes in cervical cancer. (A) Canonical pathway analysis, showing the 15 most significant activated (orange) and inhibited (blue) pathways in cervical cancer. (B) Disease and function analysis of the identified 614 gene transcripts in cervical cancer, showing the 15 main influenced diseases and functions. (C) Combined analysis performed with the terms “malignant solid tumor,” “epithelial cancer,” and “female genital tract cancer,” showing the influenced gene transcripts in cervical cancer as grouped by their protein distributions in the infected cells. Red, upregulated; green, downregulated; orange, predicted activation; blue, predicted inhibition; gray, effect not predicted. (D) Top three networks of interest (ERK1/2, histone H3, and NFкB) were generated. Red, higher expression in cervical cancer; green, lower expression in cancer tissue samples. The solid and dashed lines in panels C and D represent direct and indirect relationships, respectively. An asterisk after a gene symbol indicates multiple transcript IDs for the same gene.

