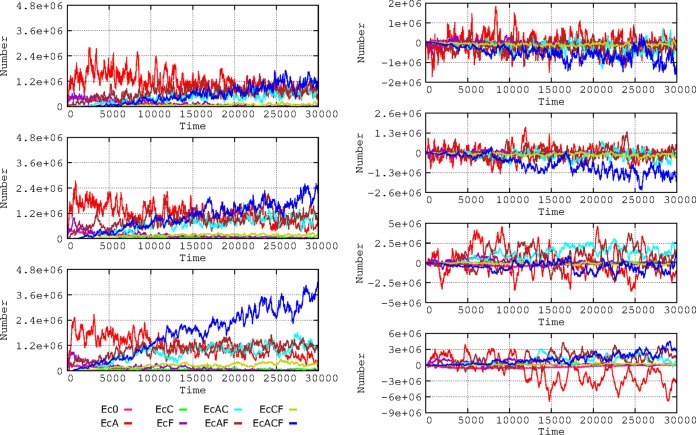
FIG 6.
Influence of flow of patients between hospital and community. On the left, influence on E. coli resistance phenotypes in the hospital when one patient is admitted at/discharged from the hospital every 2 (top), 4 (middle), or 8 hours (bottom). On the right, subtractive representation of E. coli phenotypes in the hospital: 2 h versus 4 h (first panel); 4 h vs. 8 h (second panel). Below, E. coli phenotypes in the community with a flow of 2 h versus 4 h (third panel); 4 h vs. 8 h (fourth panel).

