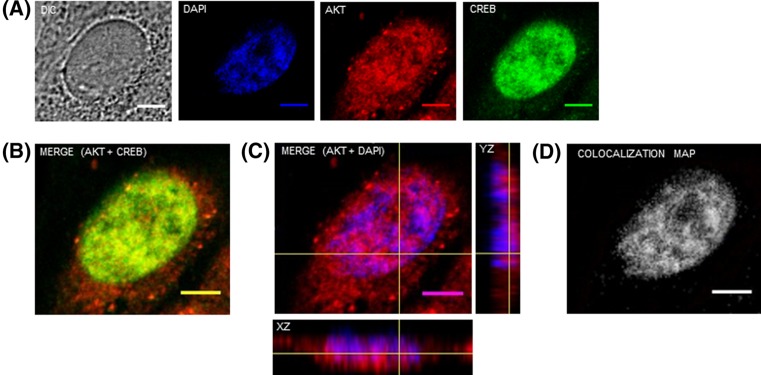
Figure 1. AKT is localized in the nucleus of melanoma cells.
A2058 cells were double immunostained for AKT and CREB and analyzed by confocal laser-scanning microscopy. Images are projections of one stack from the middle plane of the nucleus. (A) AKT is shown in red, CREB is shown in green, DAPI-stained nuclei are shown in blue and DIC represents differential interference contrast image. (B) Merged image of endogenous AKT and CREB. (C) Merged image of AKT and DAPI. The yellow cross in the merged panel of AKT and DAPI shows the confocal z-series reconstruction and corresponding xz and yz orthogonal planes. Confocal image and orthogonal views show that AKT immunostaining is localized in melanoma cells nuclei. (D) Co-localization map for AKT and DAPI, obtained using the Colocalization Threshold plugin for ImageJ, shows pixels with positive signals for both probes in white; scale bar, 5 μm.

