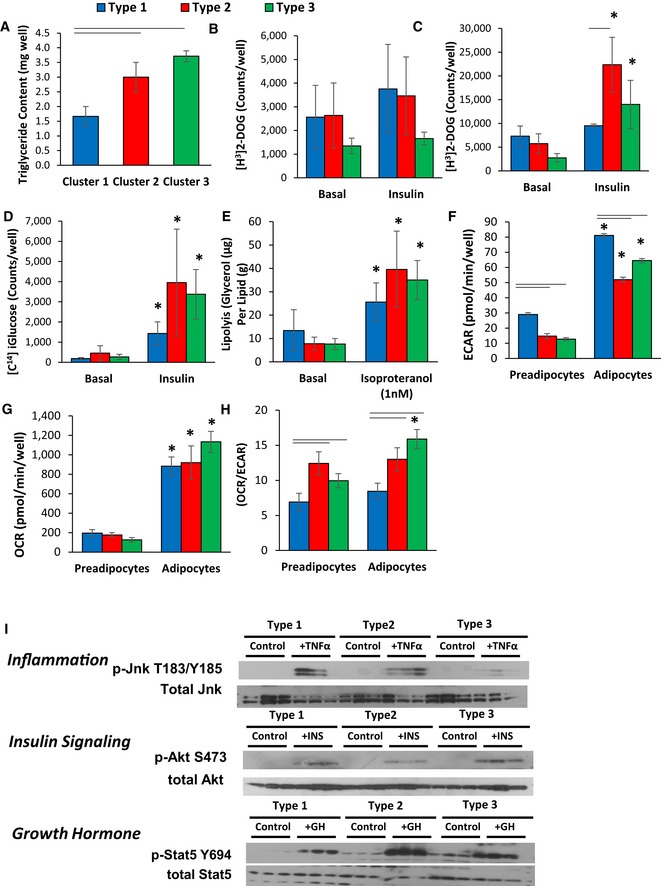
Triglyceride content of cell cultures after 6 days of differentiation using the protocol described in
Materials and Methods. Data are shown as mean ± SEM of 3–7 samples, and the entire experiment was repeated twice.
[3H]‐labeled 2‐deoxyglucose uptake in preadipocyte cell lines in the basal state and after pretreatment for 20 min with 100 nM insulin. Uptake was measured for 1 h, and data are shown as mean ± SEM of 3–7 samples and repeated twice.
[3H]‐labeled 2‐deoxyglucose uptake in adipocytes after 6 days of adipogenic differentiation in the basal state and after stimulation for 20 min with 100 nM insulin. Uptake was measured for 1 h, and data are shown as mean ± SEM of 3–7 samples. The experiment was repeated twice.
[14C] D‐glucose incorporation into lipids in adipocytes after 6 days of adipogenic differentiation in the basal state and after stimulation for 20 min with 100 nM insulin. [14C] D‐glucose incorporation was measured after 3 h, and data are shown as mean ± SEM of 3–7 samples. The experiment was repeated twice.
Lipolysis rates after stimulation with 1 nM isoproterenol as measured by glycerol release from adipocytes after 6 days of adipogenic differentiation. Data are shown as mean ± SEM of 3–7 replicates and normalized by lipid content of the cells. The entire experiment was repeated twice.
Extracellular acidification rate (ECAR) of preadipocytes and adipocytes after 4 days of in vitro differentiation was determined by calculating the area under the curve (AUC) during measurements of basal respiration. The whole experiment was repeated three times. Data are shown as mean ± SEM of 3–7 cell lines per group.
Basal respiration of preadipocytes and adipocytes after 4 days of in vitro differentiation was determined by calculating the area under the curve (AUC) during measurements of oxygen consumption rate (OCR). The whole experiment was repeated three times. Data are shown as mean ± SEM of 3–7 cell lines per group.
Ratio of oxygen consumption rate (OCR) to extracellular acidification rate (ECAR) of preadipocytes and adipocytes after 4 days of in vitro differentiation. Data are shown as mean ± SEM of 3–7 cell lines per group.
Representative Western blot analysis of three independent adipocyte cell lines after 6 days of in vitro differentiation for: pJnk T183/Y185 and total Jnk after treatment with 10 nM TNFα for 15 min (Inflammation); pAkt S473 and total Akt after treatment with 100 nM insulin for 15 min (Insulin Signaling); pStat5 Y694 and total Stat5 after treatment with 500 nM GH for 20 min (Growth Hormone).
< 0.05; two‐way ANOVA) in all panels. In panels (C–E), asterisks indicate significant differences between basal and treated samples (
test). In panels (F–H), asterisks indicate significant differences between preadipocytes and adipocytes (
test).