
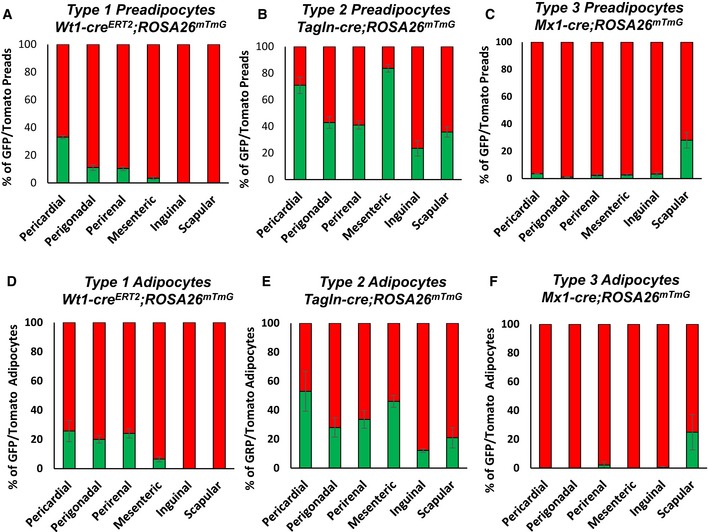
Figure EV5. Preadipocytes and adipocyte subpopulations in female mice.
-
A–CNumber of mGFP‐ and mTomato‐positive preadipocytes isolated by FACS from each of the indicated white adipose depots from 5‐ to 6‐month‐old female Wt1‐creERT2;Rosa26mT/mG, Tagln‐cre;Rosa26mT/mG, and Mx1‐cre;Rosa26mT/mG mice. Data are shown as mean ± SEM of 4–9 mice.
-
D–FQuantitation of mGFP‐ and mTomato‐positive adipocytes from each of the indicated white adipose depots from 5‐ to 6‐month‐old female Wt1‐creERT2;Rosa26mT/mG, Tagln‐cre;Rosa26mT/mG, and Mx1‐cre;Rosa26mT/mG mice. Adipocytes were counted from four non‐overlapping images/depot/mouse. Data are shown as mean ± SEM of 4–9 mice.