
Figure 3. Mitochondrial membrane potential is unchanged in tau‐expressing cells.
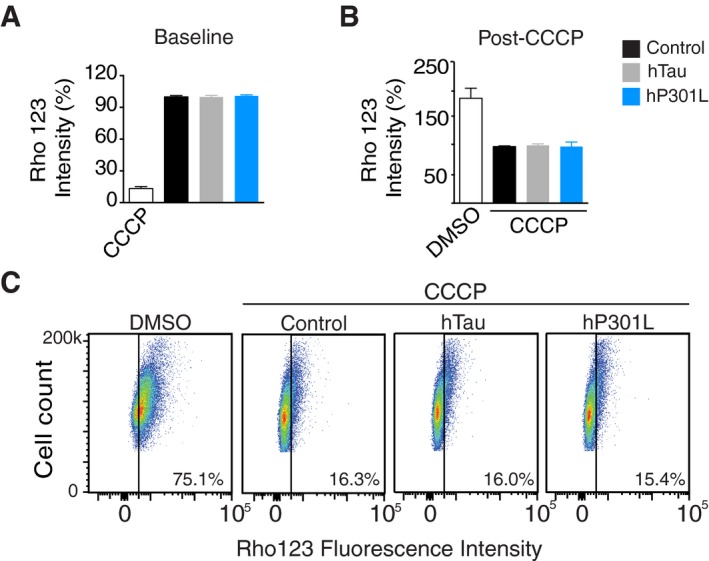
- FACS analysis of cells loaded with Rhodamine 123. The geometric mean fluorescence was calculated and expressed as % of the empty vector control. A CCCP‐treated cohort was included as a positive control, but not included in the statistical analysis. Data were analysed by one‐way ANOVA, F(2, 14) = 0.196, P = 0.8245.
- FACS analysis of cells treated with CCCP after 24 h of tau expression. Data were analysed by one‐way ANOVA, F(2, 15) = 0.434, P = 0.6555. The DMSO negative control is shown but was not analysed statistically.
- Representative dot plots of cells loaded with Rhodamine 123. The gates (black line) were set in unstained cells to distinguish Rhodamine‐positive cells (right half) from Rhodamine‐negative cells (left half).