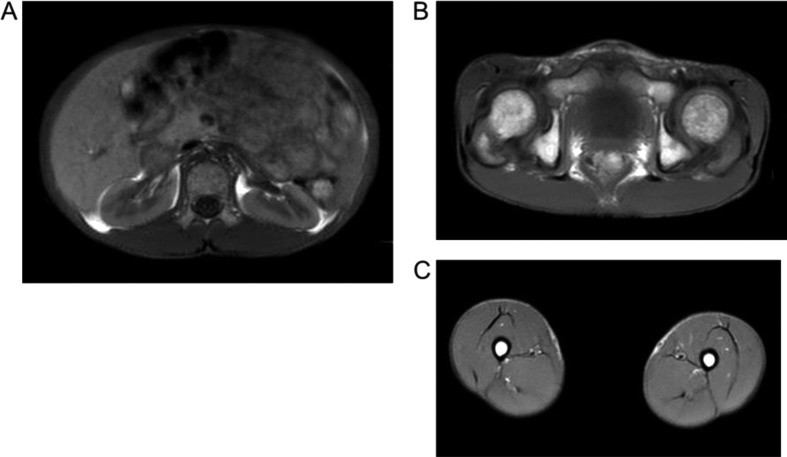
Fig. 2.
Axial T1-weighted magnetic resonance images taken at the umbilical level (A), hip joint level (B), and thigh level (C). Fat typically appears at a high intensity in images; however, the incidence of high intensity areas was reduced, particularly in the subcutaneous area, suggesting that the amount of systemic subcutaneous adipose tissue was markedly decreased.

