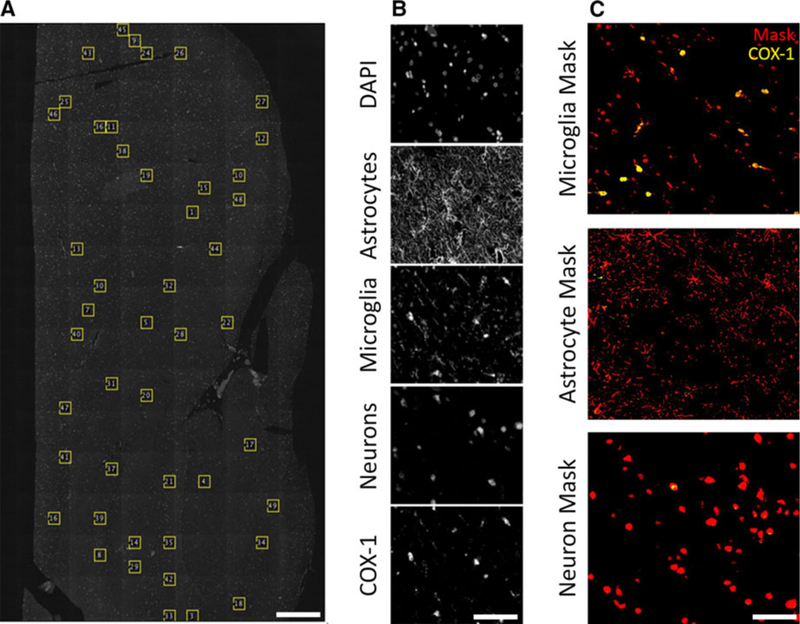
FIGURE 1.

An overview of the methods used to analyze protein expression. Whole pieces of tissue were scanned using a fluorescence slide scanning microscope. A, From each piece of tissue, up to 50 regions of interest (ROIs) were randomly selected using a script written in ImageJ. B, Every ROI contained 5 channels for the inflammation expression experiments, and 4 channels for the ATP‐binding cassette (ABC) transporter correlation experiments. An example set of channels from the former is shown (top to bottom): DAPI, glial fibrillary acidic protein (GFAP), ionized calcium‐binding adapter molecule 1 (IBA‐1), neuronal nuclei (NeuN), and cyclooxygenase‐1 (COX‐1, shown), COX‐2, or translocator protein (TSPO). C, Masks (shown in red) were then generated from the GFAP, IBA1, and NeuN images, and the expression of COX‐1 (shown in yellow), COX‐2, or TSPO was measured within the mask. Scale bar is equal to 1 mm (A), and 60 μm (B, C)
