-
A, B
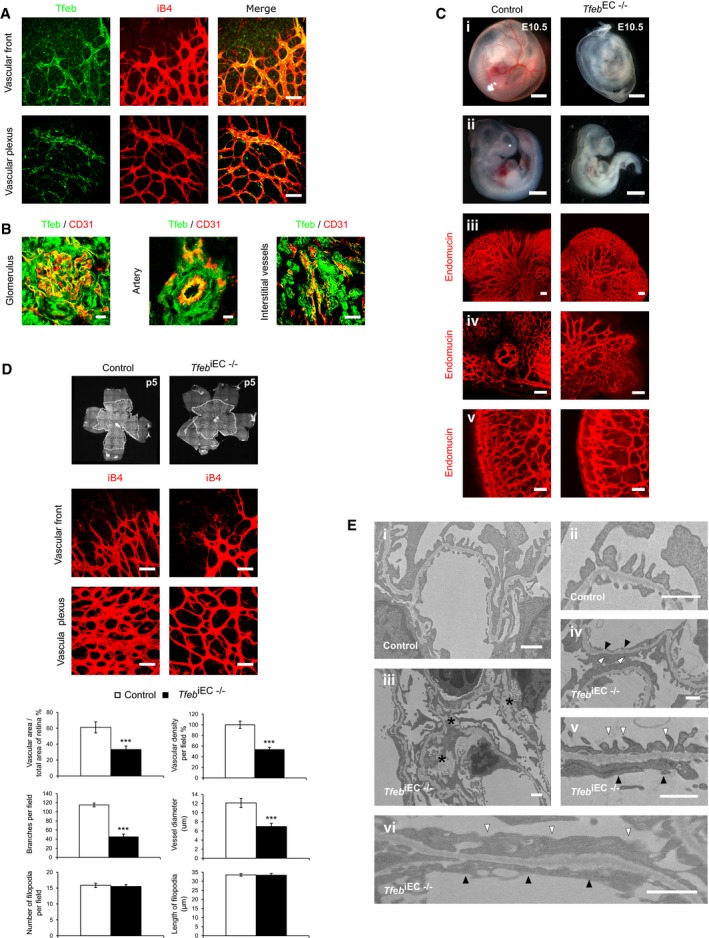
Tfeb expression in the vasculature (mice n = 10). (A) Representative images of retinal vessels (p5) (A) (scale bar: 50 μm) and (B) glomerular, arterial (scale bars: 10 μm) and interstitial vessels (scale bar: 50 μm) of kidney (p17) of Tfeb‐EGFP mice stained with anti‐iB4 (A), anti‐CD31 (B) and anti‐GFP (A,B).
-
C
Alterations in the embryonic vasculature in Tfeb
EC−/− mice at E10.5 (mice n = 25). Representative images of whole‐mount embryos and yolk sacs (i, ii) (scale bars: 0.5 mm). Vessels of the head (iii), ocular (iv), and intrasomitic regions (v) were stained with anti‐endomucin Ab (scale bars: 100 μm).
-
D
Alteration of retinal vascular maturation in Tfeb
iEC−/− at p5. Representative images of whole mounts of retina and immunostaining of vascular front and vascular plexus with an anti‐iB4 Ab (scale bars: 50 μm). Bar graphs indicate the percent of vascular area versus total area of the retina, the percent of vascular density, the number of branches per field, vessel diameter, the number of filopodia per field, and the length of filopodia (mice n = 10, mean ± SEM; ***P < 0.0001 versus control mice by Student's t‐test).
-
E
Alteration of the glomerular ultrastructure in Tfeb
iEC−/− mice at p17 (mice n = 5). Representative transmission electron micrographs of renal tissue. Magnification: (i) ×6,000, (ii) ×20,000), (iii–iv) ×10,000, (v–vi) ×25,000; scale bars: 1 μm). Asterisks indicate the accumulation of extracellular matrix in mesangium; white and black triangles indicate the fusion of podocyte foot processes and the lack of endothelial fenestrae, respectively.

