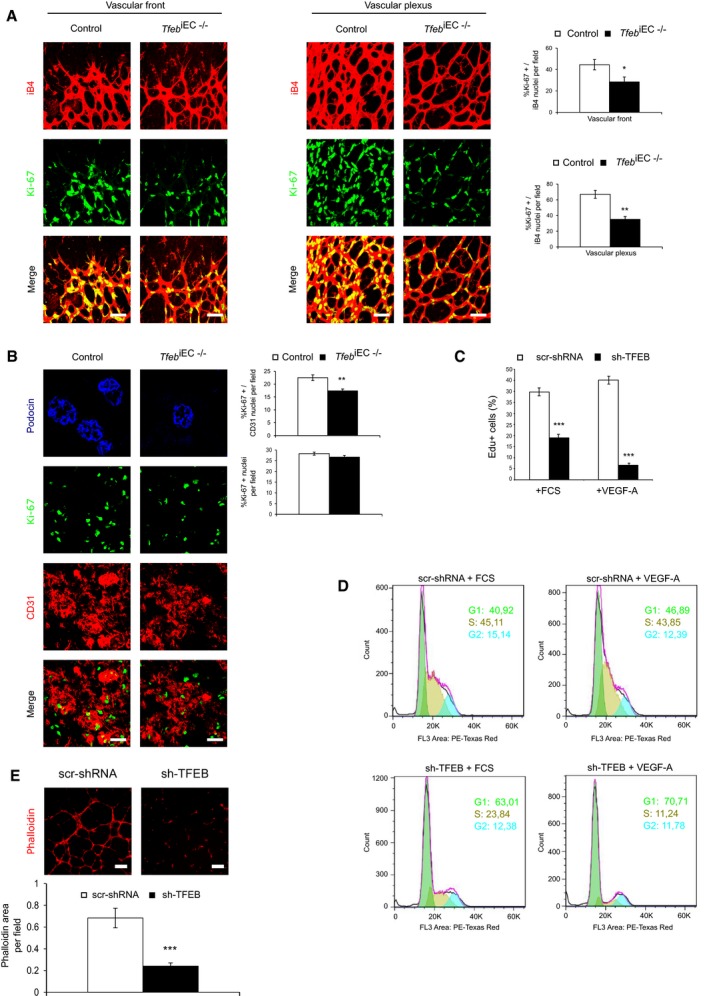
Figure 2. Tfeb deletion reduces EC proliferation in vivo.

-
A, BReduced EC proliferation in the retina (p5) and kidney (p17) of in Tfeb iEC−/− mice. (A) Representative images of vessels of the vascular front and vascular plexus in the retina of control and Tfeb iEC−/− mice stained with anti‐iB4 and Ki‐67 antibodies (scale bars: 50 μm). Bar graph indicates the percentage of EC Ki‐67+ nuclei versus total nuclei co‐localized with iB4+ vessels (mice n = 6, mean ± SEM; **P < 0.001 and *P < 0.01 versus control mice by Student's t‐test). (B) Representative images of vessels of the kidney in control and Tfeb iEC−/− mice stained with anti‐CD31 and Ki‐67 antibodies (scale bars: 50 μm). Bar graph indicates the percent of EC Ki‐67+ nuclei versus total nuclei co‐localized with CD31+ vessels (mice n = 6, mean ± SEM; **P < 0.001 versus control mice by Student's t‐test). Podocin staining is shown to glomerular localization.
-
C, DTFEB silencing reduced EC proliferation. Representative graph of scr‐shRNA and sh‐TFEB ECs treated for 24 h with FCS (20%) or VEGF‐A (30 ng/ml). (C) DNA incorporation of EdU was detected by flow cytometry. The percentage of proliferating cells is indicated (n = 4, mean ± SEM; ***P < 0.0001 versus scr‐shRNA ECs by Student's t‐test). (D) DNA content was determined by propidium iodide staining and assessed by fluorescence‐activated cell sorter analysis (representative experiment out of 4 with similar results).
-
ETFEB silencing reduced human EC morphogenesis. Representative images of tube‐like structure of scr‐shRNA and sh‐TFEB human ECs stained with phalloidin‐555. Bar graph indicates the percentage of phalloidin+ area in sh‐TFEB and scr‐shRNA ECs (scale bars: 0.25 mm; n = 6, mean ± SEM; ***P < 0.0001 versus scr‐shRNA by Student's t‐test).
