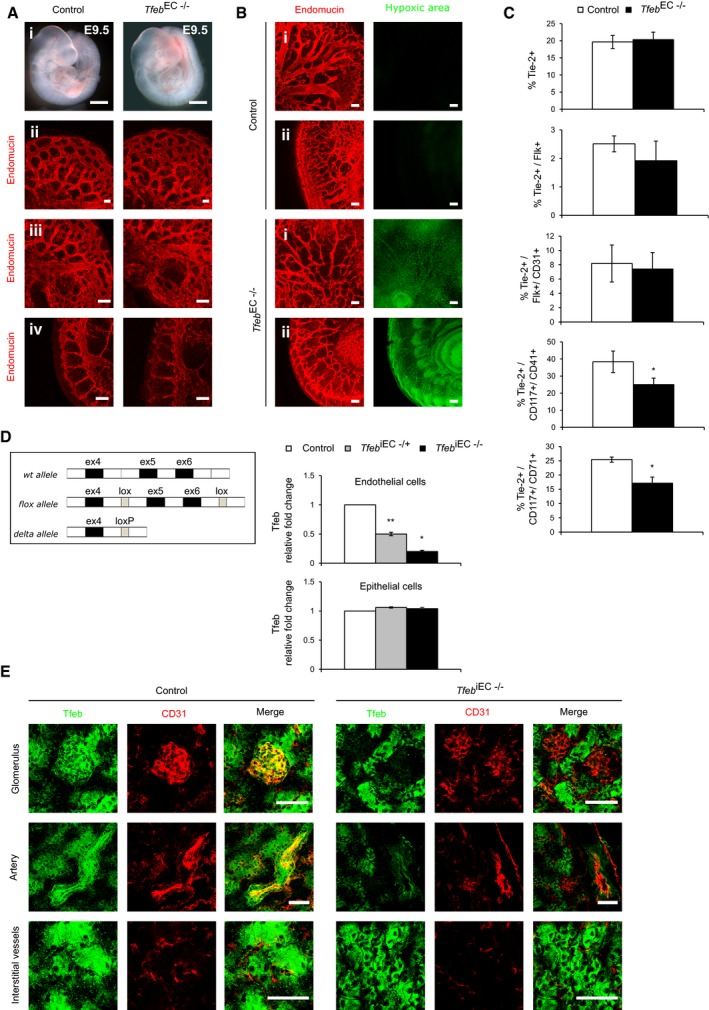
EC Tfeb deletion does not induce alterations in the embryonic vasculature at E9.5 (embryos n = 6). Representative images of whole‐mount embryos (i) (scale bars: 0.5 mm). Vessels of the head (ii), ocular (iii), and intrasomitic regions (iv) were stained with anti‐endomucin Ab (scale bars: 100 μm).
EC Tfeb deletion induces embryonic hypoxia at E10.5 (embryos n = 6). Representative images of vessels and tissues of the head (i) and intrasomitic region (ii) of control and Tfeb
EC−/− embryos stained with anti‐endomucin (red) and the hypoxic marker pimonidazole (green; scale bars: 100 μm).
Expression of Tie2 and markers of the endothelial and hematopoietic lineages in TfebEC−/− yolk sacs at E9.5. Bar graphs indicate the percentage of yolk sac Tie2+ cells or Flk+ or CD31+ or CD117+/CD41+ and CD117+/CD71+ within the Tie2+ population (n = 3, mean ± SEM; *P < 0.01 versus control mice by Student's t‐test).
Genotype of Tfeb
iEC mice. Schematic representation of murine Tfeb, the targeted allele and the knockout allele (delta allele), and qPCR analysis of mRNA encoded by Tfeb exon 5–6 in lung ECs and epithelial cells isolated from control, Tfeb
iEC−/+, and Tfeb
iEC−/− mice. Data are expressed as relative fold‐change compared with the expression in control mice after normalization to the housekeeping gene TBP (mice n = 3, mean ± SEM; *P < 0.01 and **P < 0.001 versus control mice by Student's t‐test).
Tfeb expression in renal tissue of control and Tfeb
iEC−/− mice (p17). Representative images of renal glomerulus, artery, interstitial vessels, and the surrounding tissue of control and Tfeb
iEC−/− mice (mice n = 6). Tissues were stained with anti‐CD31 and anti‐GFP Abs (scale bars: 100 μm).

